
US$ 3,000 Gold Likely By Year-End
U.S. M1 Exploding
The Fed has stepped up to the mark in the COVID–19 crisis in an unprecedented manner. The monetary base is still growing as is US M1, with the latest report showing an extraordinary rate of increase in response to this extraordinary crisis.
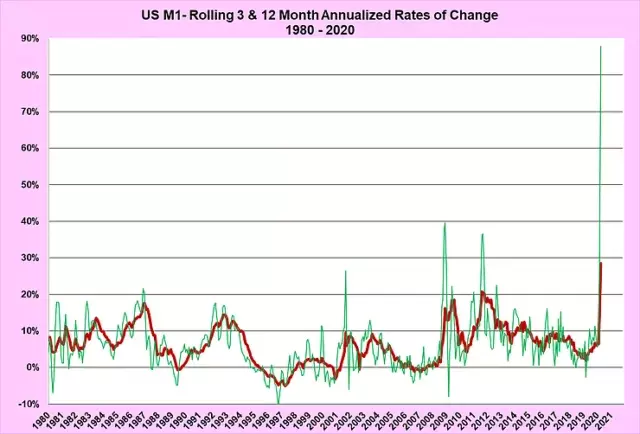
Chart by Author from FRED Data
Fed Expands Monetary Base but Banks Fail to React.
The latest data on the monetary base released by the Fed shows that yet again the banks have still not pushed out any money out into the real economy than was the case at the end of February. This is despite the additional creation of US$ 1.6 trillion in just nine weeks and the elimination of all reserve requirements.
The nine-week increase of US$ 1.6 trillion is double the US$ 0.8 trillion that was in existence in August 2008. Given this, it is incredible that the banks are still sitting on any reserves, let alone excess reserves of US$ 3.2 trillion.
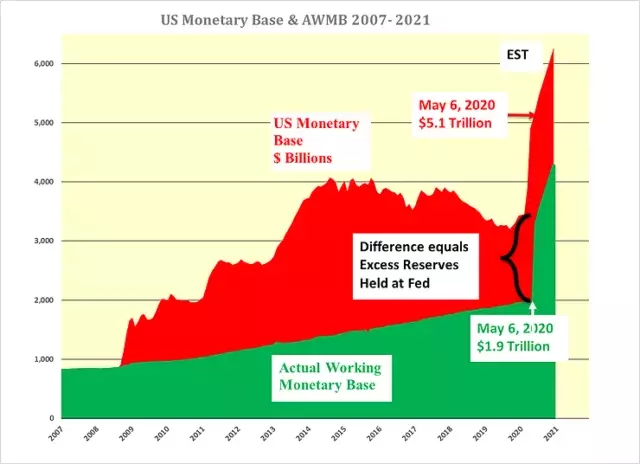
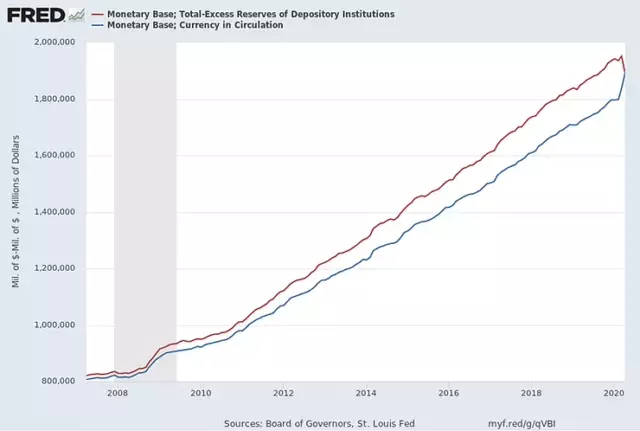
Chart by Author from FRED Data
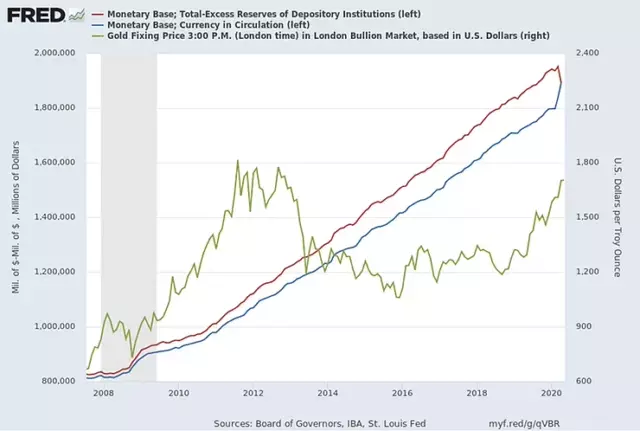
In the last nine weeks, excess reserves held at the Fed have jumped from US$ 1.5 trillion to US$ 3.2 trillion. Despite the huge increase, there has been no movement of the monetary base beyond the banks into the real economy.
Since Lehman, the AWMB has been rising at a rate slightly in excess of the increase of the U.S. currency in circulation until the past couple of months when the two came back in line by virtue of a decline in the AWMB by virtue of the elimination of required reserves and a 100 billion jump in the currency in circulation as shown in the following FRED graph.
Previously it was demonstrated that the monthly average U.S. dollar price of gold tended to rise with the general increase in the U.S. monetary base. Post Lehman that relationship was expected to continue as it did for a while.
However, that ended when it was realized the money created by the Fed was being sterilized by the banks which just retained it as excess reserves encouraged by the Fed which for the first time paid interest on such excess reserves.
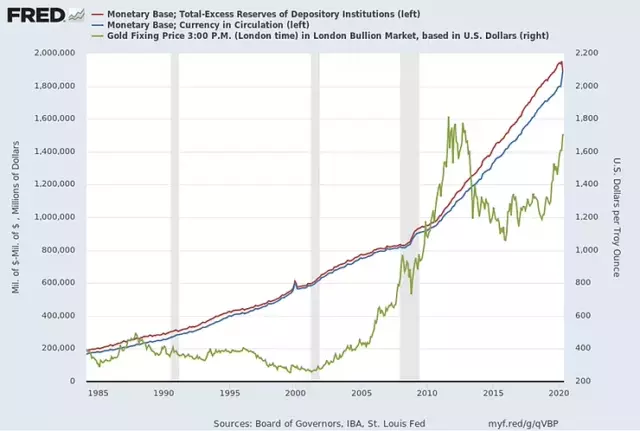
The spike in the gold price in September 2011, to the monthly average peak price of US$ 1,772, was also partially the result of some large gold producers closing out their respective hedge positions.
Since then the U.S. dollar price of gold has increased with the gradual rise in the AWMB. Now both the Fed and the U.S. government are acting together to push money on to Main Street it is highly probable that AWMB is set for a rapid surge as is the amount of U.S. currency in circulation, which are now effectively the same.
As there is no incentive for banks to hold excess reserves at the Fed it must surely be recognized that the current explosion of the monetary base is intended for the benefit of the U.S. economy and not to restore comfort for the banks as was the case post-Lehman. This is a very different action and intent from the climb out of the great financial crisis.
In short, the monetary and fiscal stimulus are intended to revive the economy and reduce unemployment as quickly as possible. Inflation in the short term is unlikely to be a problem. However, both the Fed and the government will be reluctant to cause a second recession by putting on the brakes any time soon. It seems more probable they will overshoot on the upside and inflation could well start to rear its head again in the medium term three years hence.
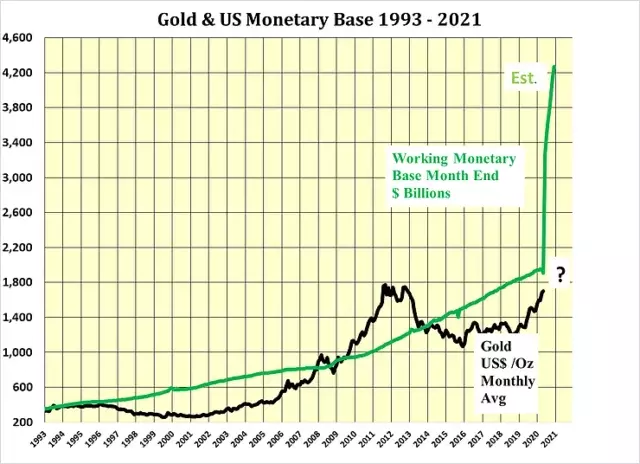
Chart by Author from FRED Data
With the prospect of rapid and substantial increases in both the AWMB and the amount of U.S. currency in circulation, it seems highly probable the U.S. dollar gold price is set to follow.
Why are the banks still holding back?
The banks are still acting like grade-school ink-well monitors holding back the Fed's intentions regarding QE even though the IOER is at only 0.10%. Perhaps this is a little harsh but they are certainly slow in lending money even though much of the promised loans are back-stopped by the U.S. government.
Gold Price Jack-in-the-box about to be released
The London p.m. gold fix peaked at $1,895 per oz. on September 6, 2011. The monthly average fix, however, was only US$ 1,772 per oz. for the entire month of September 2011. The highest annual average price was achieved in 2012 at US$ 1,656 per oz.
By comparison, the highest daily price this year was recorded on April 14 at US$ 1,742 per oz. For the whole of April, the gold fix averaged US$1,683 per oz. The average so far in May is US$ 1,699 per oz. The cumulative average price for the year so far is US$ 1,613 per oz. There is a clear groundswell of interest in gold which should continue for quite a while as the monetary base is finally allowed to flow through to the real economy.
Trading around US$ 1,700 per oz. oz. the gold price is just beginning to anticipate the flood of money that is supposed to be released into the real economy. When the expected deluge of money finally hits, it becomes a question for the gold price of, how high is up?
Chart by Author from FRED Data
It is only a matter of a very short time before the flood barriers, which are being held back by the commercial bankers, give way and the new money hits the AWMB. At which point gold should really move considerably higher, initially to US$ 2,000 this quarter and then to over US$3,000 by year-end.
Beyond that one has to wonder how any government is going to work its way out of debt other than by its monetization. The more one thinks about this, the more probable it becomes as it would be the easiest, and perhaps the only, route for governments to take. This points to a return of inflation and gold has historically been a great wealth protector against such an outcome.
In conclusion, the price of gold is ringing the early warning of the Tsunami of money that has been created by central banks around the world. As this money breaches the flood barriers held closed by commercial banks and makes its way into the real economy the Actual Working Monetary Base (AWMB) should rise sharply and with it the price of gold in all currencies. It seems obvious that the Fed’s action provides in advance a phenomenal opportunity to:
BUY GOLD AND GOLD SHARES AND TAKE NO PRISONERS!
While gold itself is obviously attractive there is much greater leverage to be had by investing in the shares of gold companies, particularly junior companies. The larger companies and royalty companies such as Franco Nevada are already showing their mettle.
Junior companies are only just starting stir like Lazarus rising from the slumber of the dead in which they have been since the peak gold price in September 2011. Perhaps the best example of the juniors is seen in the performance of VanEck Vectors Gold Miners ETF compared to GLD which is a good proxy for the London Gold Fix from the peak on September 6, 2011.
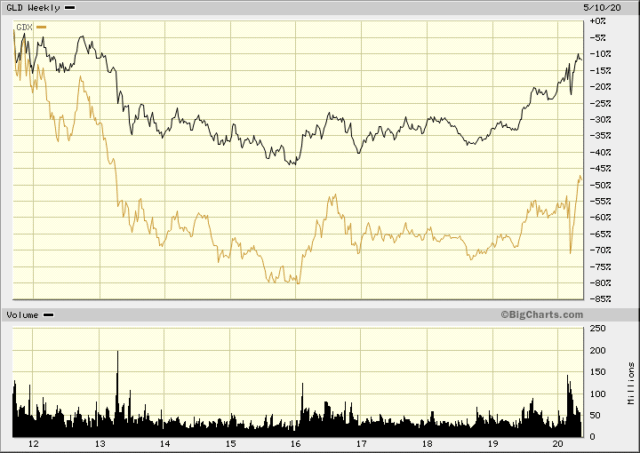
It will still take time for the gold explorers to join in the fun. However, there are some recent investments by specialty gold funds through private placements. This indicates that the funds have had capital inflows and their respective trust indentures mandate that they have to be near fully invested at all times. Private placements are a way of buying reasonable positions in what have become thinly traded issues.
FSX - An Explorer of Interest to Specialty Gold Funds
One such explorer is Fosterville South Exploration Ltd. TSXV Exchange $1.46 The Company has a property contiguous to and south of the Fosterville gold mine in Victoria, Australia which has seen a major gold discovery in the past three years that boosted its parent Kirkland Lake KL from single digits to over Can$ 67. The success came about by drilling beneath the known shallow gold pits.
Eric Sprott who owns a sizable interest in KL is also invested in FSX. The company has the same geologist as the Fosterville mine, a similar geological setting, and the same rocks of the same age as well as a history of small miners back to the late 18th century. Drilling is already underway and news should be forthcoming in the next few months.
This is a highly speculative investment but as the company is now well funded by supposedly the gold cognoscenti it seems to have a better chance than many of discovering a sizable deposit of high-grade gold. Please do your own research in the NI43-101 Technical Report Central Victorian Gold properties, State of Victoria, Australia. See SEDAR.
FSX - TSXV $1.46

Just don’t bet the ranch!
Disclosure: I have no positions in any stocks mentioned, However, I could initiate a position in FSX within the next 72 hours.
I wrote this article myself, and it expresses my own opinions. I am ...
more


Total noob question here, but what does M1 stand for?
Dear Danny,
The following is the Fed's definition
M1 consists of (1) currency outside the U.S. Treasury, Federal Reserve Banks, and the vaults of depository institutions; (2) traveler's checks of nonbank issuers; (3) demand deposits at commercial banks (excluding those amounts held by depository institutions, the U.S. government, and foreign banks and official institutions) less cash items in the process of collection and Federal Reserve float; and (4) other checkable deposits (OCDs), consisting of negotiable order of withdrawal (NOW) and automatic transfer service (ATS) accounts at depository institutions, credit union share draft accounts, and demand deposits at thrift institutions. Seasonally adjusted M1 is constructed by summing currency, traveler's checks, demand deposits, and OCDs, each seasonally adjusted separately.
Kind regards
Tony