Two Trades To Watch: Oil, FTSE

Image Source: Pixabay
FTSE is on the rise despite weak retail sales
After heavy losses yesterday the FTSE, along with its European peers is heading higher, lifted by an upbeat close on Wall Street.
Market sentiment is improving even as recession fears remain. UK PMI data yesterday showed that business activity held steady, but news orders slowed dramatically.
Today UK retail sales fell by -0.5% MoM in May after rising a downwardly revised 0.4% in April, as the cost of living squeeze sees consumers change their behavior.
The data comes as UK inflation rose to 9.1% YoY in May a 40-year high.
Where next for FTSE?
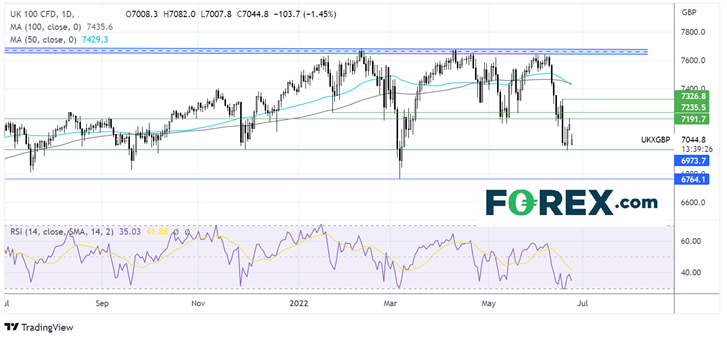
The FTSE rebounded off 7640 high in early June, falling below the 50 & 100 sma before finding support at 6966.
The 50 sma is crossing below the 100 sma in a bearish signal and the RSI suggests that there is further downside to come.
Sellers will look for a move below 6966 to extend the selloff to 6764 the 2022 low.
Buyers will look for a move above 7193 the weekly high, which could open the door to 7230.
(Click on image to enlarge)

Oil falls 5% across the week on recession fears
Oil prices are falling and are set for 5% declines across the week as recession concerns hurt the demand outlook.
Fears of an economic slowdown in the US have risen this week after Federal Reserve Chair Jerome Powell acknowledged that the US could enter a recession and after US PMI data showed a sudden drop highlighting recession concerns. The US is the largest consumer of oil.
Meanwhile, supply remains tight, although with Russia oil rerouting to China and other countries outside of Europe supply might not be as tight as initially feared.
OPEC is due to meet next week and is likely to stick to the plan after agreeing to a 648k barrel rise in July and the same in August.
Where next for oil prices?
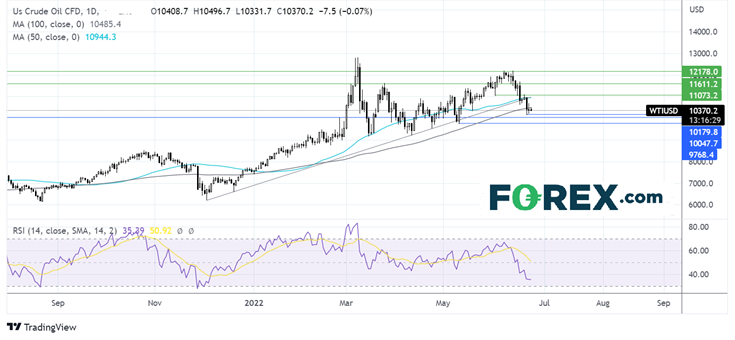
WTI crude oil rose to 121.90 in mid-June, before plunging lower, falling below its 50 & 100 sma and its multi-month rising trendline. The price found support at 101.40 which can now be treated as immediate support. The RSI supports further downside.
Sellers will look for a move below 101.40 to create a lower low, bringing round number 100.00 into focus. A break below here opens the door to 97.50 the May 10 low.
On the upside, immediate resistance can be seen at the 100 sma 105.00, ahead of 109.50 the 50 sma, rising trendline, and June 2 low, which could prove a tough nut to crack.
(Click on image to enlarge)


