
The Upcoming Gold Moves: More Clarity Emerges
Gold declined and silver plunged. Gold to silver ratio temporarily spiked to 88. And you know that it’s not shocking or surprising – it’s all unwinding just like it was likely to. Applying the techniques that successfully detected the recent corrective upswing and its end, to what we have right now, provides us with price and time targets for the next bottom. It might even be a buying opportunity.
Let’s start with gold. Both analogies that we recently commented on, tell us that gold is likely to slide, if not immediately then in a couple of days, but they provide limited clarity with regard to the bottoming price. The link between what’s going on now and what happened in 2012-2013 points to about $1,240 at the target price.
Gold’s Two Analogies
(Click on image to enlarge)
(Click on image to enlarge)
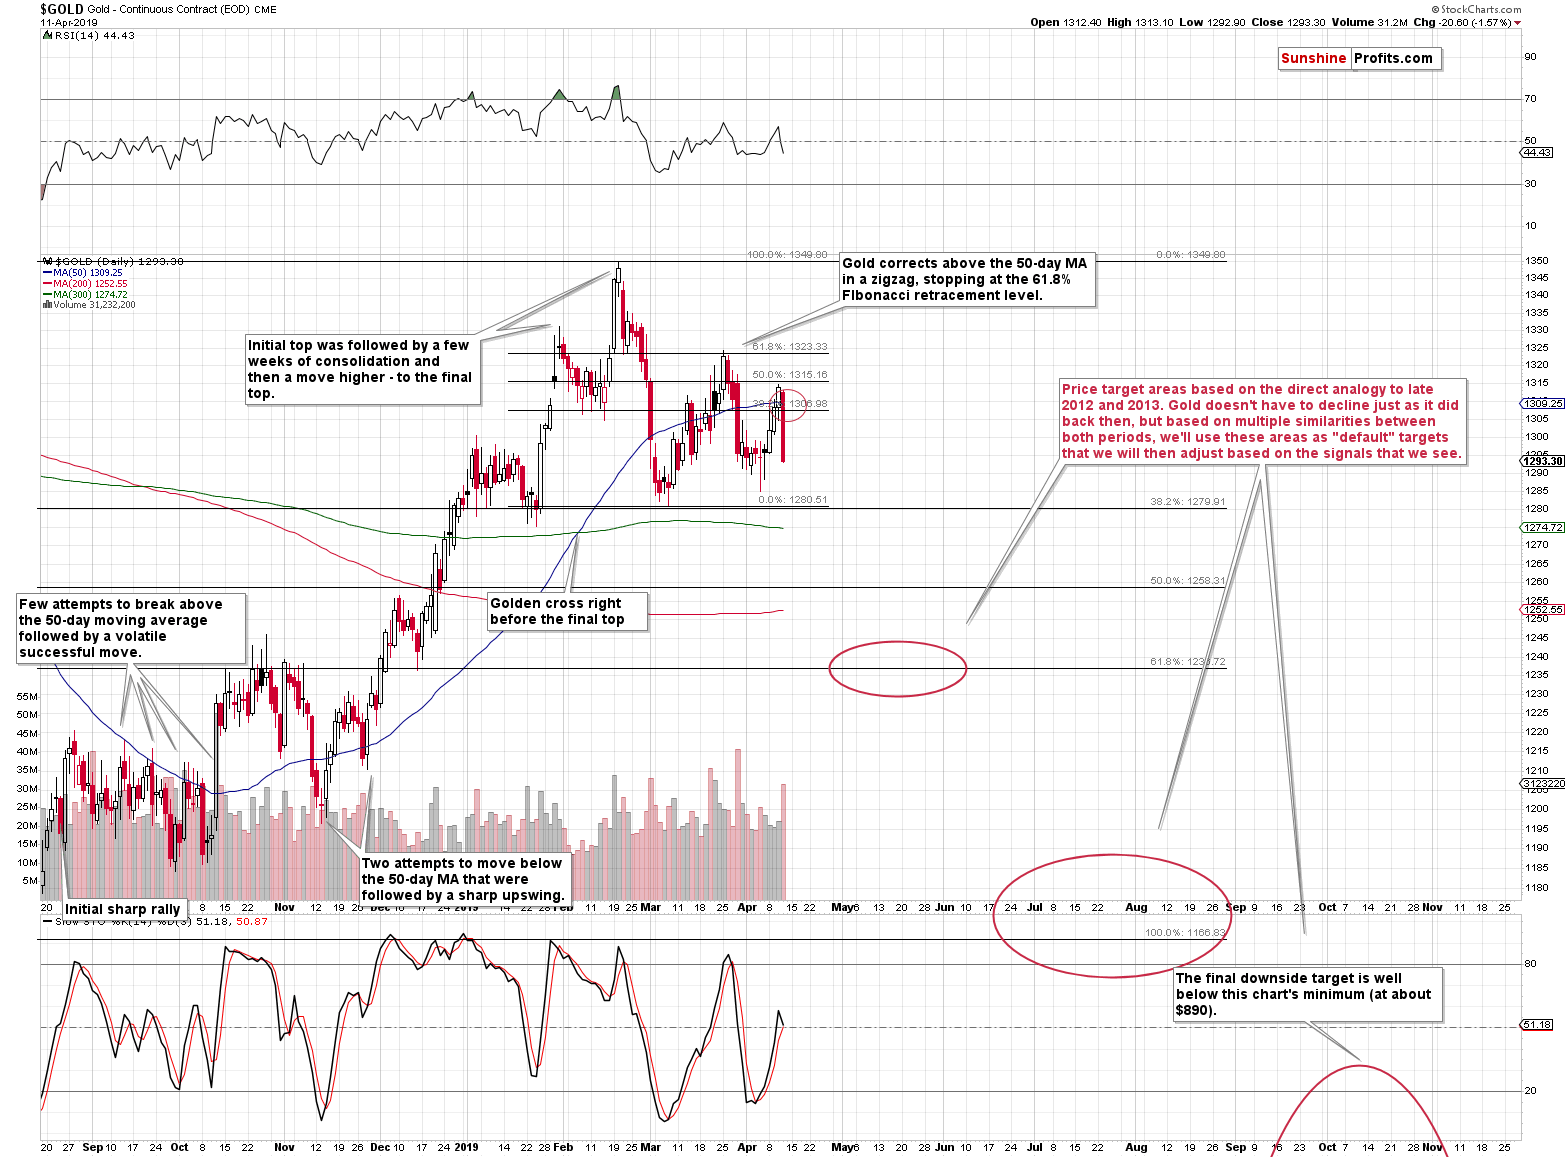
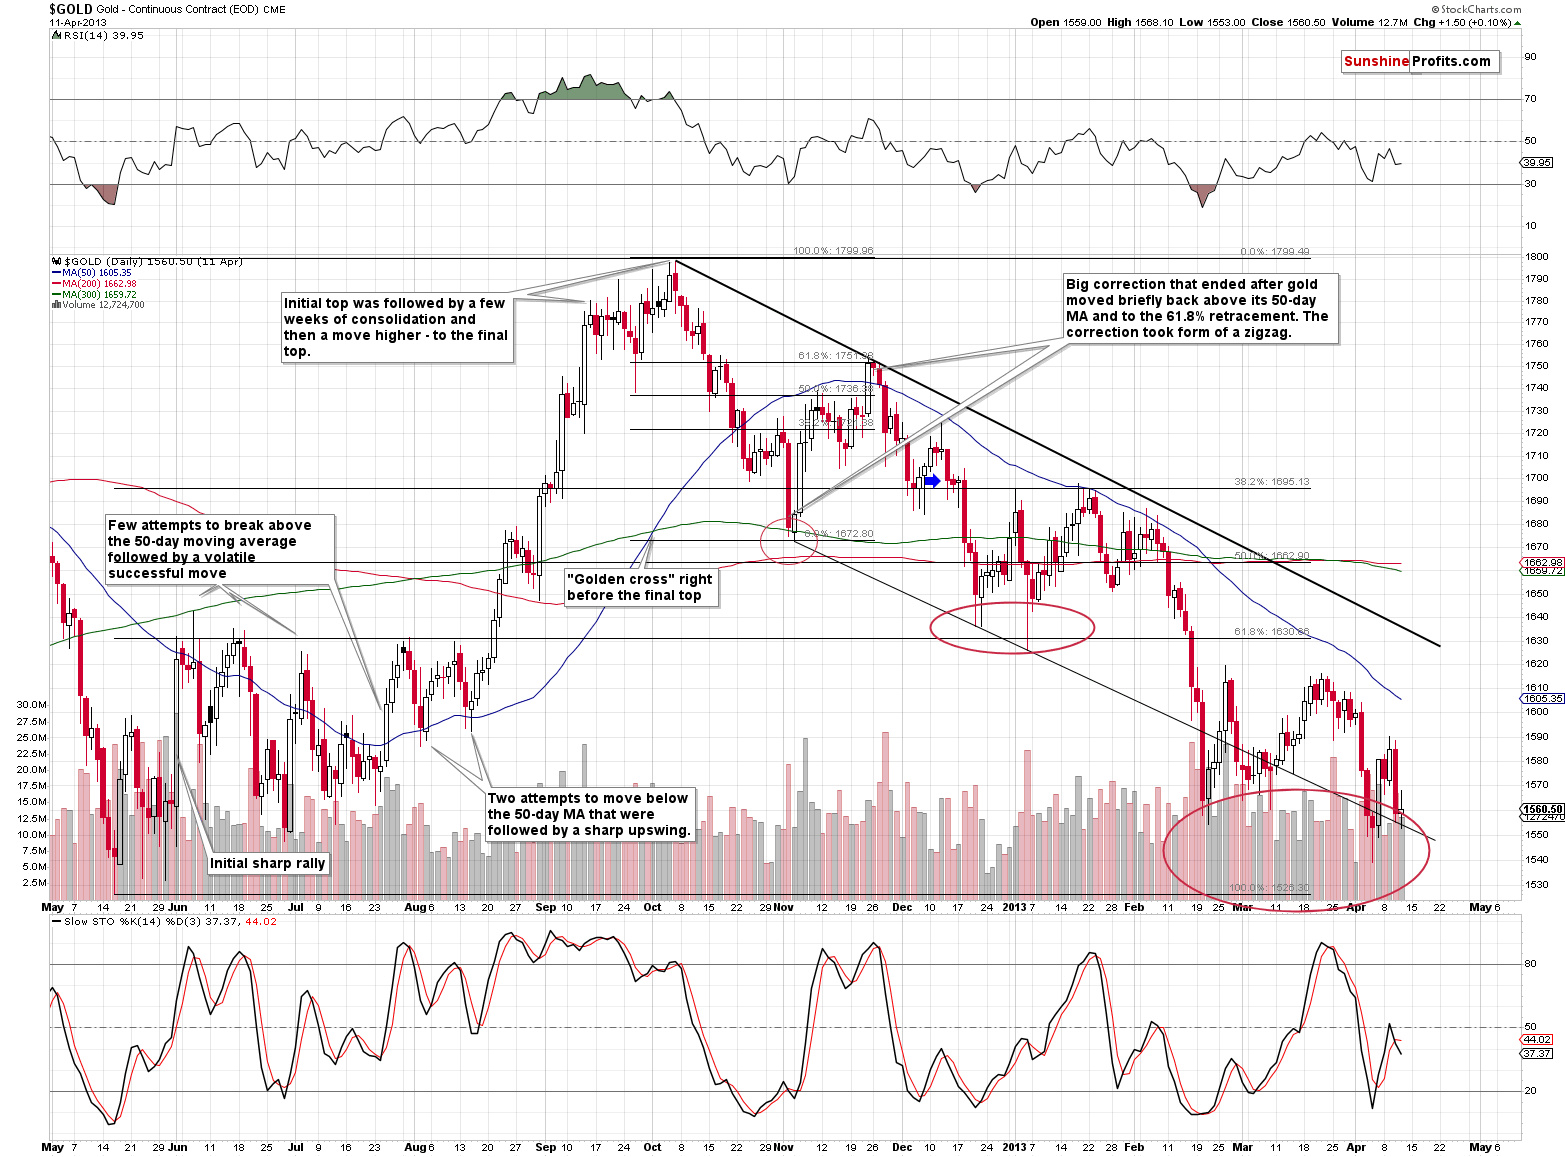
We previously noted that the early December upswing had ended with a reversal during which gold had almost reached the 50-day moving average. This time, gold moved slightly higher, but the tiny moves above the 38.2% Fibonacci retracement and the 50-day moving average were invalidated shortly. The link to how gold performed in 2012 clearly remains in place and it’s quite odd that we’re the only ones that noticed it.
Just like what we saw in December 2012 during the first post-correction decline day (we marked it with a blue arrow), yesterday’s move took gold almost to the previous lows, but not below them. In December, what followed were 2 days of pause and then the decline accelerated. Something similar could very well take place this time. In fact, it’s already taking place. Gold is doing next to nothing, which is in perfect tune with what happened previously. It’s not bullish – it’s normal.
The next major target is $1,240 because it’s the rounded proximity of the 61.8% Fibonacci retracement ($1,237). That’s the level that triggered a corrective upswing in late 2012 and early 2013. This technique is quite reliable for the gold market in general, but the above analogy gives it even greater credibility.
We wrote about two analogies in gold, so let’s move to the second one.
(Click on image to enlarge)
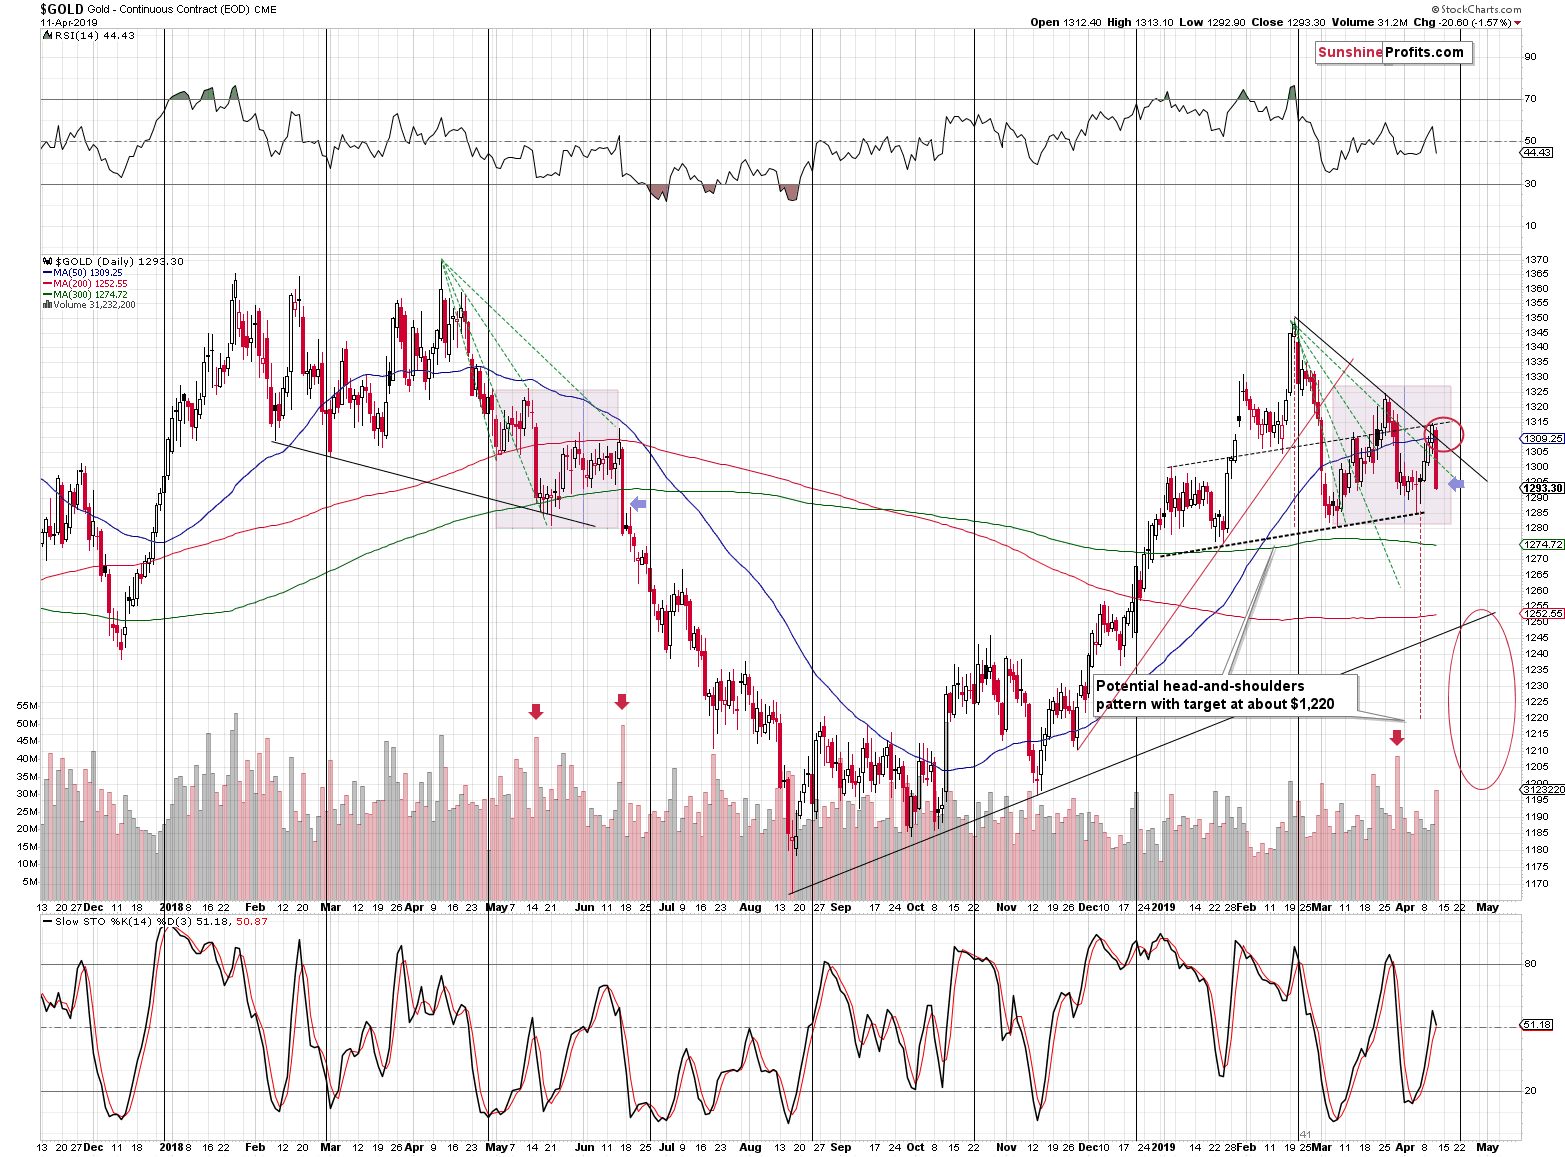
The second analogy is to the mid-2018 decline. The decline accelerated once it broke below the nearest support line and the previous lows. In 2018, it happened in June. We are not yet at this stage, but we are very close. We marked the similar days with blue arrows.
Based on the above analogy, we can expect gold to slide until it reaches the previous important bottom. The nearest important bottom is at about $1,200 (formed in November 2018). There are also two smaller bottoms that might also trigger a temporary reversal: the late-November bottom at about $1,210 and the mid-December bottom at about $1,236. The latter is very close to the previously mentioned 61.8% Fibonacci retracement, which gives it more credibility than the remaining levels.
There’s also the head-and-shoulders formation that will come into play once gold breaks below the neck level. It’s relatively close – at about $1,285, so gold would need to decline by only $8 from yesterday’s close to reach it. The target based on this formation is created by applying the size of the “head” to the moment and price of the breakdown. This technique points to $1,220 as the likely target for gold.
Of course, there’s also the rising support line that’s based on the August and November 2018 lows and it points to $1,250 as the likely near-term target.
How to Play Gold’s Decline
(Click on image to enlarge)
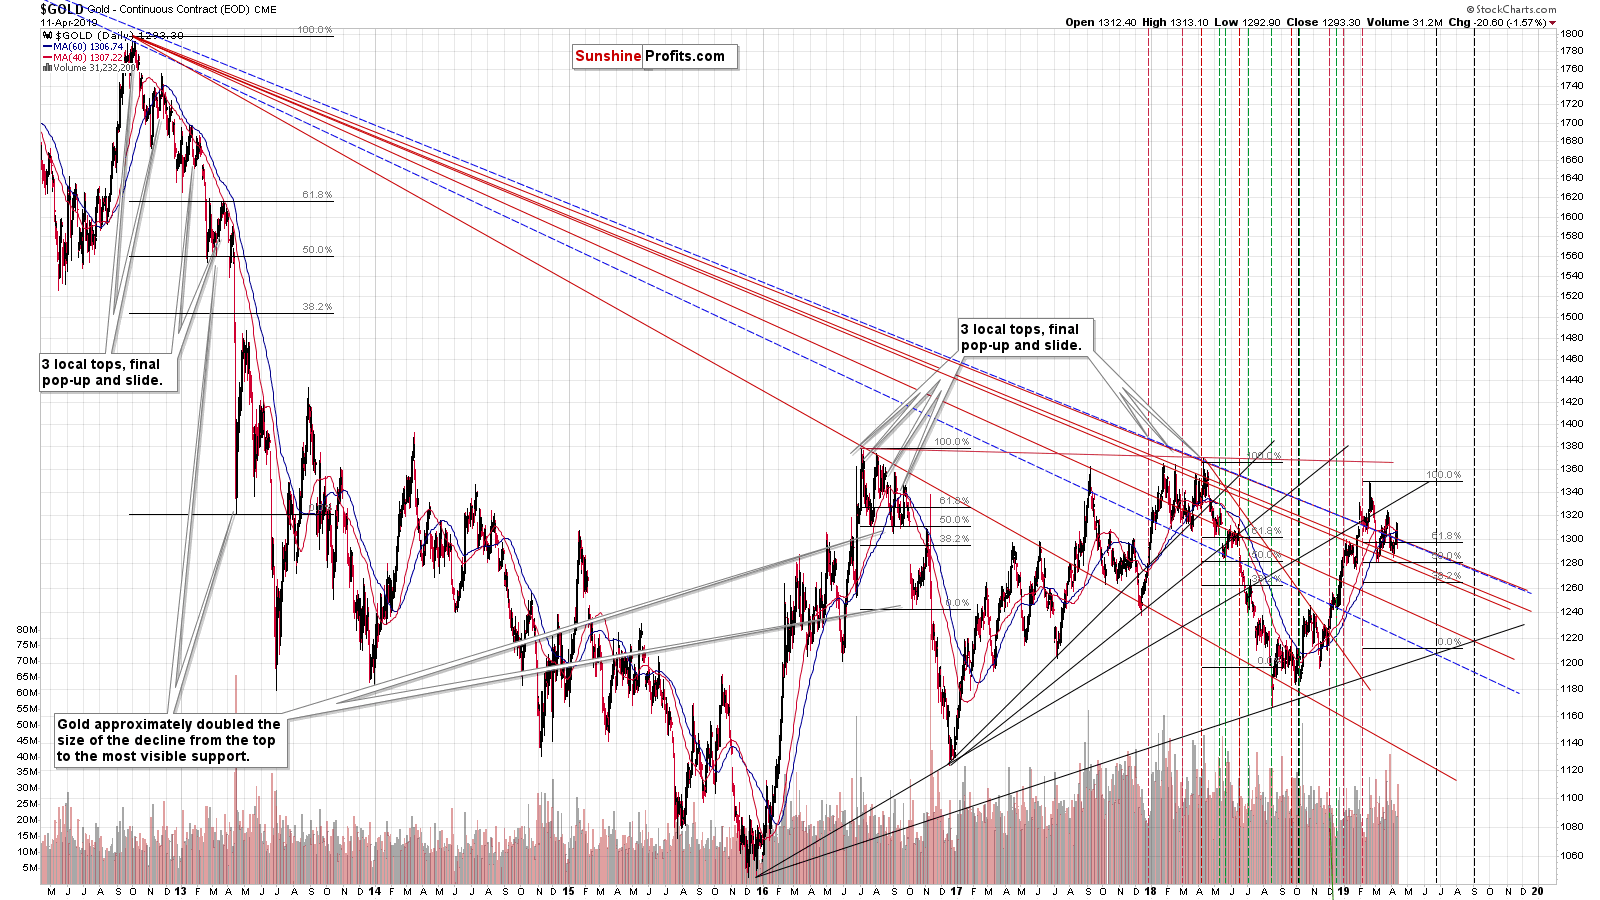
Let’s see the gold chart with reversal dates after applying the triangle apex reversal method. Applying the price extension technique suggests that gold might move to about $1,215 before forming a short-term bottom.
On Tuesday, we commented on the above chart in the following way:
The first rule is that there are three tops before the decline really starts. There’s also a smaller correction and that’s pretty much it – then gold just drops.
The early-2013, September 2016, and May 2018 upswings were all the above-mentioned “smaller corrections” after which gold took a dive.
In 2019, the late-January top, the late-February top, and the late-March top were the three tops as per the above-mentioned rule. What we’re seeing now is likely the final “smaller correction” after which gold is likely to take a dive.
The second rule is that an important intermediate bottom takes place at the price that we get by doubling the size of the initial volatile drop. On the above chart, we applied this rule by using the Fibonacci retracements in a non-standard way. The starting point is the top (for instance the 2012 top) and the second point that we use is the initial bottom (February 2013 bottom) to which we apply the 50% Fibonacci retracement. The end of the Fibonacci tool shows where gold would need to be in order to double the initial the decline.
This technique worked in all three major declines that we see above: the initial 2013 slide, the late-2016 decline, and the 2018 decline. The important thing is that this technique doesn’t necessarily point to the final bottom – just an intermediate one.
In case of the current situation, this technique points to about $1,215 as the next downside target.
Consequently, we have quite a few near-term targets for gold that range from $1,200 to $1,250. Based on the way gold declines, it will be more likely or less likely that there will either be a single bigger correction or a few smaller ones. For instance, in mid-2018 there were two moderate corrections during the downswing – one took place in early July and the other in mid-July. If gold plunges to $1,200 in a sharp manner without looking back, we’ll likely have a bigger correction. The volatile slide would represent a very emotional move and traders would need to cool down before being ready for another wave lower.
But, if gold declines steadily, it’s likely to correct a few times in an insignificant manner. The former outcome would provide a good trading opportunity, but the latter would probably not.
What’s the best course of action here? To wait and see how gold declines, while at the same time looking for clues also from other markets such as silver and mining stocks to arrive at more coherent targets.
You can read more about these and other gold trading tips here.
Gold to Silver Ratio Update
(Click on image to enlarge)
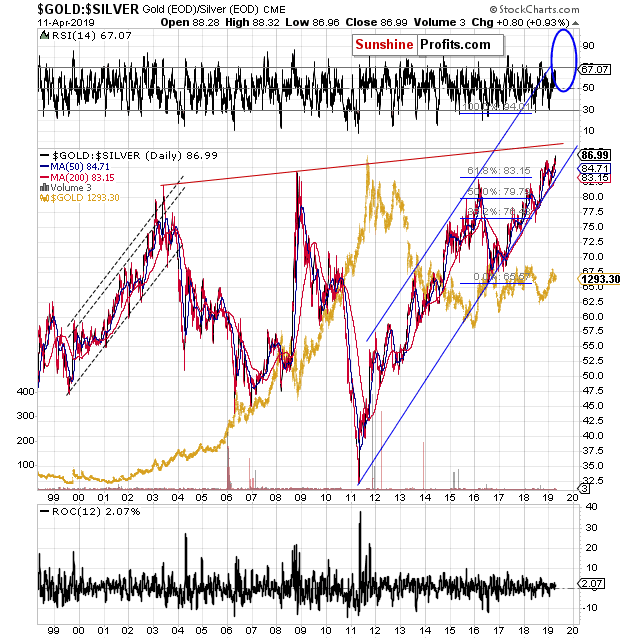
The gold-silver ratio temporarily moved to 88 yesterday, which is a clear sign that the breakout has been confirmed, and the ratio can now move much higher. We received a message about this ratio from one of our subscribers and it seems that our reply might benefit everyone, so here you are.
Thank you once more for your analysis. Probably one of the your most sharp analysis yet on silver. You’ve been providing many reasons over time to hold on long term purchase of silver and it seems that the stars should align when silver will reach its buying ultimate point when the gold silver ratio will approach 100, when SIL will double bottom @ around 14. I believe it should happen around 10$/ounce. It’s my guess which correspond to 200 Months Moving Average of Gold @1020usd. As I mentioned earlier, the probability that gold stay below 1000$ is very low.
We are also thankful for the message and we agree with almost all of the above points. There will most likely be a much better time to invest in silver for the long run than at the current moment. We do think that the white metal will soar well above the previous $50 top, but not before it declines significantly first. The gold to silver ratio is likely to reverse at 100 and this is quite likely to correspond to the final bottom and buying opportunity. While gold may not stay below $1,000 for long (and silver below $10), the move below these levels could be very volatile. Both price levels are very round, and it will generate a lot of attention. Everyone and their brother (even the non-financial press) will likely comment on how bad investments gold and silver are. And very initially this is likely to generate a wave of selling that pushes their prices to their final lows. At some point, everyone considering selling will have done so, and the buyers will take over. The bottom will be in and it will be THE buying opportunity. Perhaps the buying opportunity of a lifetime.
As far as SIL is concerned, we wouldn’t be surprised to see it even below the 2016 bottom of $14. Gold is likely to break below its previous lows. Silver is likely to break below its own lows very soon (it seems that it’s ready to test them shortly). And the gold stocks are likely to slide as well. The latter are underperforming gold on a medium-term basis, so if gold moves below its 2015 bottom, the gold miners most likely also will. If everything else is declining and breaking below the previous lows, why would silver stocks be likely to show enough strength and resist? In our view, they won’t manage to do that. And that’s actually good because this would provide even greater opportunity to buy into the silver miners at extremely discounted prices.
Summary
Summing up, the small corrective upswing in the precious metals sector is over and the medium-term downtrend has likely resumed. Based on the likelihood of seeing a temporary turnaround in the next 1-3 weeks, we are moving the profit-take levels higher in order to take advantage of a possible sudden decline.
Disclaimer: All essays, research, and information found on the Website represent the analyses and opinions of Mr. Radomski and Sunshine Profits' associates only. As such, it may prove wrong ...
more

