
The technical analysis last month highlighted the mixed environment at the time:
The indicators are once again giving some mixed signals. The price action is definitely needing further consolidation. However, other indicators suggest a market that is just getting started. … Either way, downside does seem limited at this point, especially considering all the bad news has been priced in.
The pullback from recent highs is still a healthy correction after the price action got a bit ahead of itself. “Limited downside” means that $1880 could be tested in the worst case, but should hold. The price could certainly turn around before then though. The current pullback is laying the groundwork for a strong and healthy up-leg that should finally take Gold to a new all-time high.
Resistance and Support
Gold
Once the possibility of new all-time highs faded, the metal-faced a stiff pullback. In the end, this will only make the burst through that much stronger though. For now, the shorts are attacking $1950 with a lot of confidence. There does not seem to be any immediate catalyst to push gold higher so the path of least resistance is still down.
Outlook: Short-term bearish
Silver
Silver has really struggled to hold onto $25 and $26. It saw a major pullback last week that preceded the move in gold. It’s now consolidating. The fact it held in well once gold started to fall and didn’t see further weakness is a good sign. That said, it still needs to get back into the $26 range to regain its bullish momentum.
Outlook: Neutral
(Click on images to enlarge)
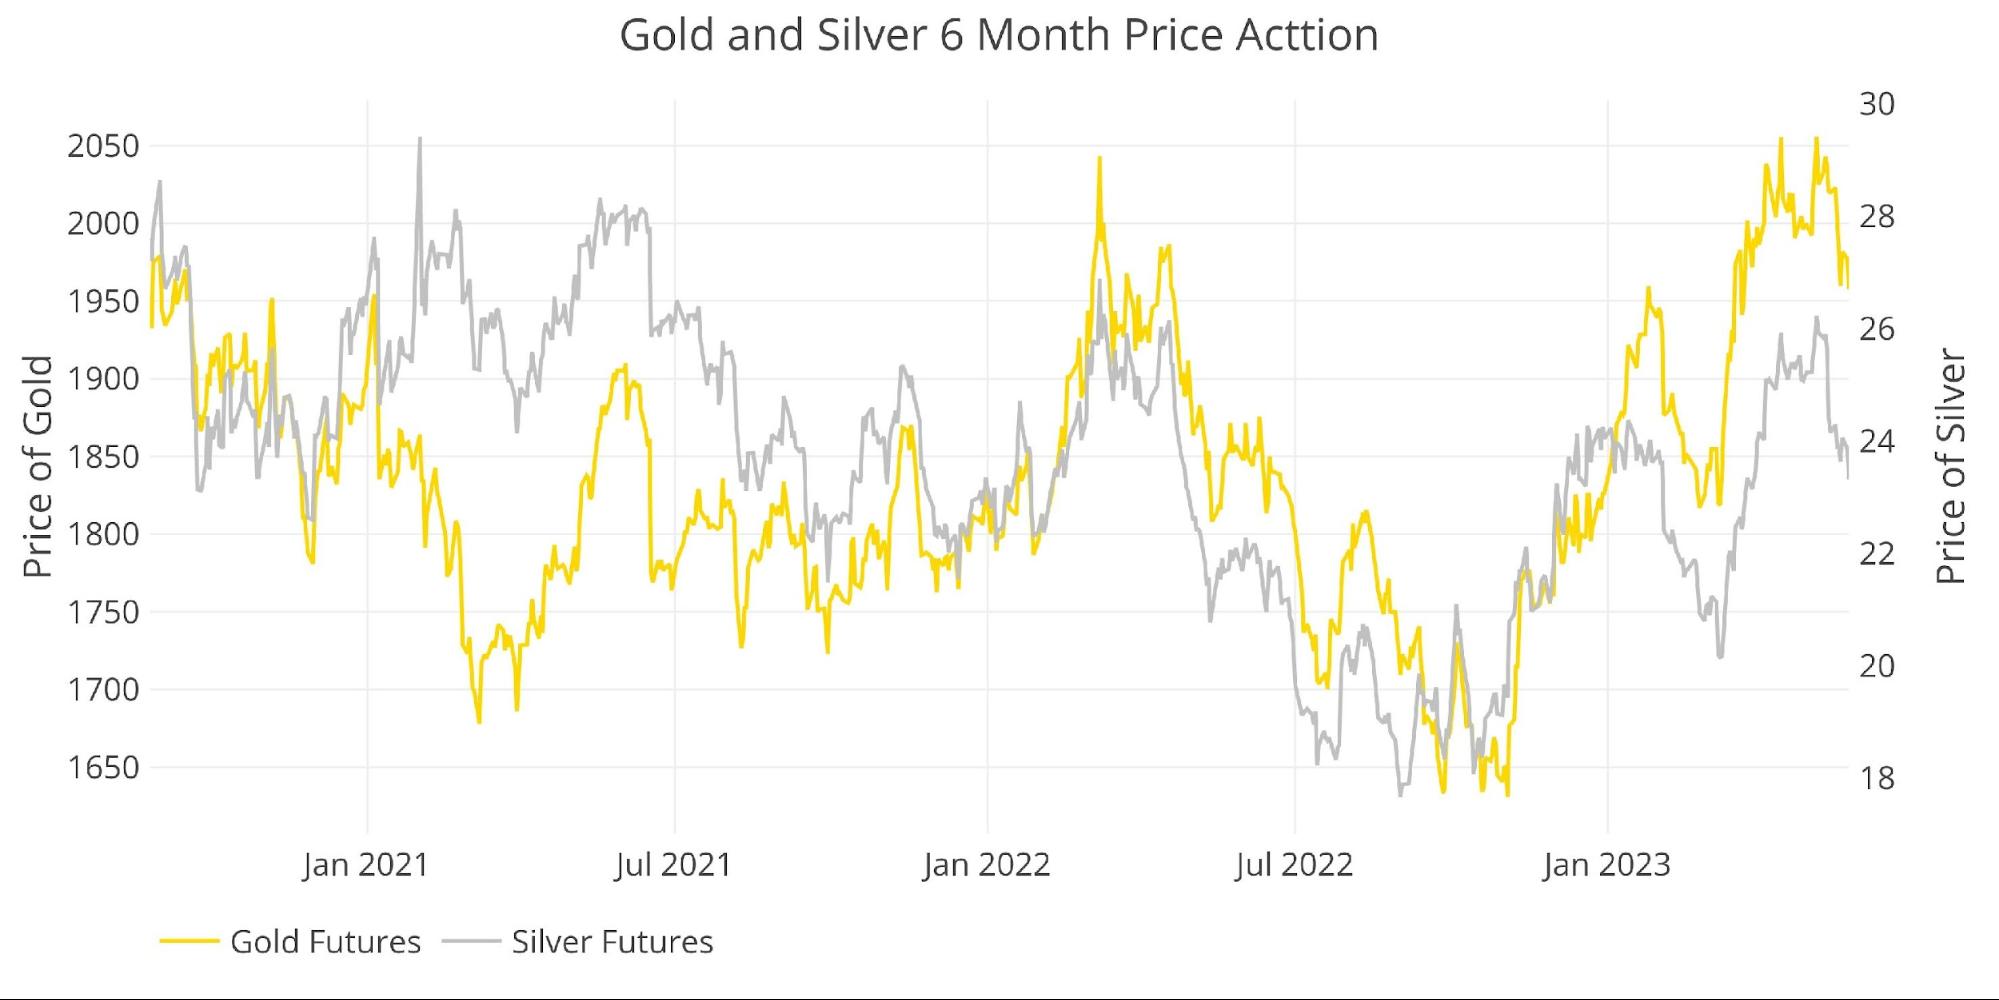
Figure: 1 Gold and Silver Price Action
Daily Moving Averages (DMA)
Gold
Gold has fallen below the 50 DMA, but this isn’t enough of a consolidation. Because of the rapid advance, the 200 DMA remains well below both the current price and the 50 DMA. While the market is in a bullish posture, the gap suggests more correction or consolidation is needed.
Outlook: Short-term neutral/bearish, medium-term very bullish
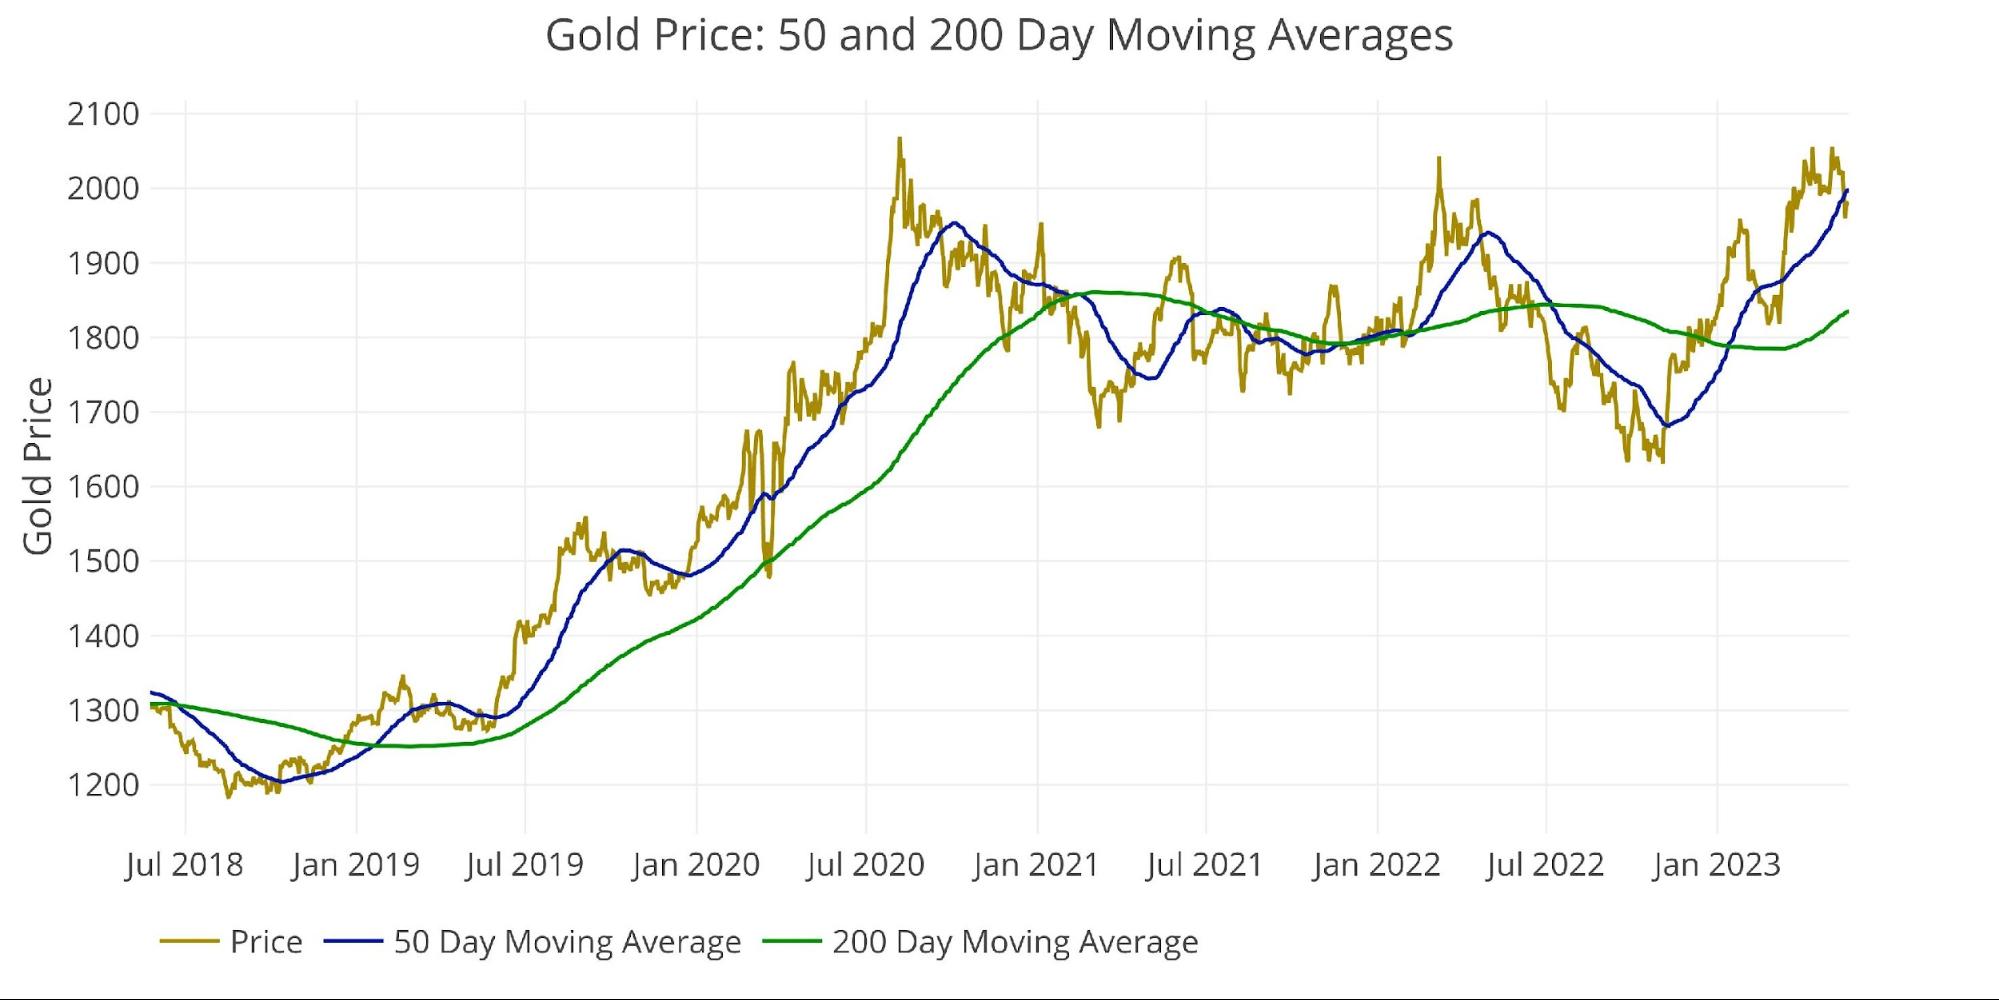
Figure: 2 Gold 50/200 DMA
Silver
Same update as gold with one addition, the silver 50 DMA has not gotten so far out in front of the 200 SMA since 2020. This called for a needed and healthy correction.
Outlook: Short-term neutral/bearish, medium-term very bullish
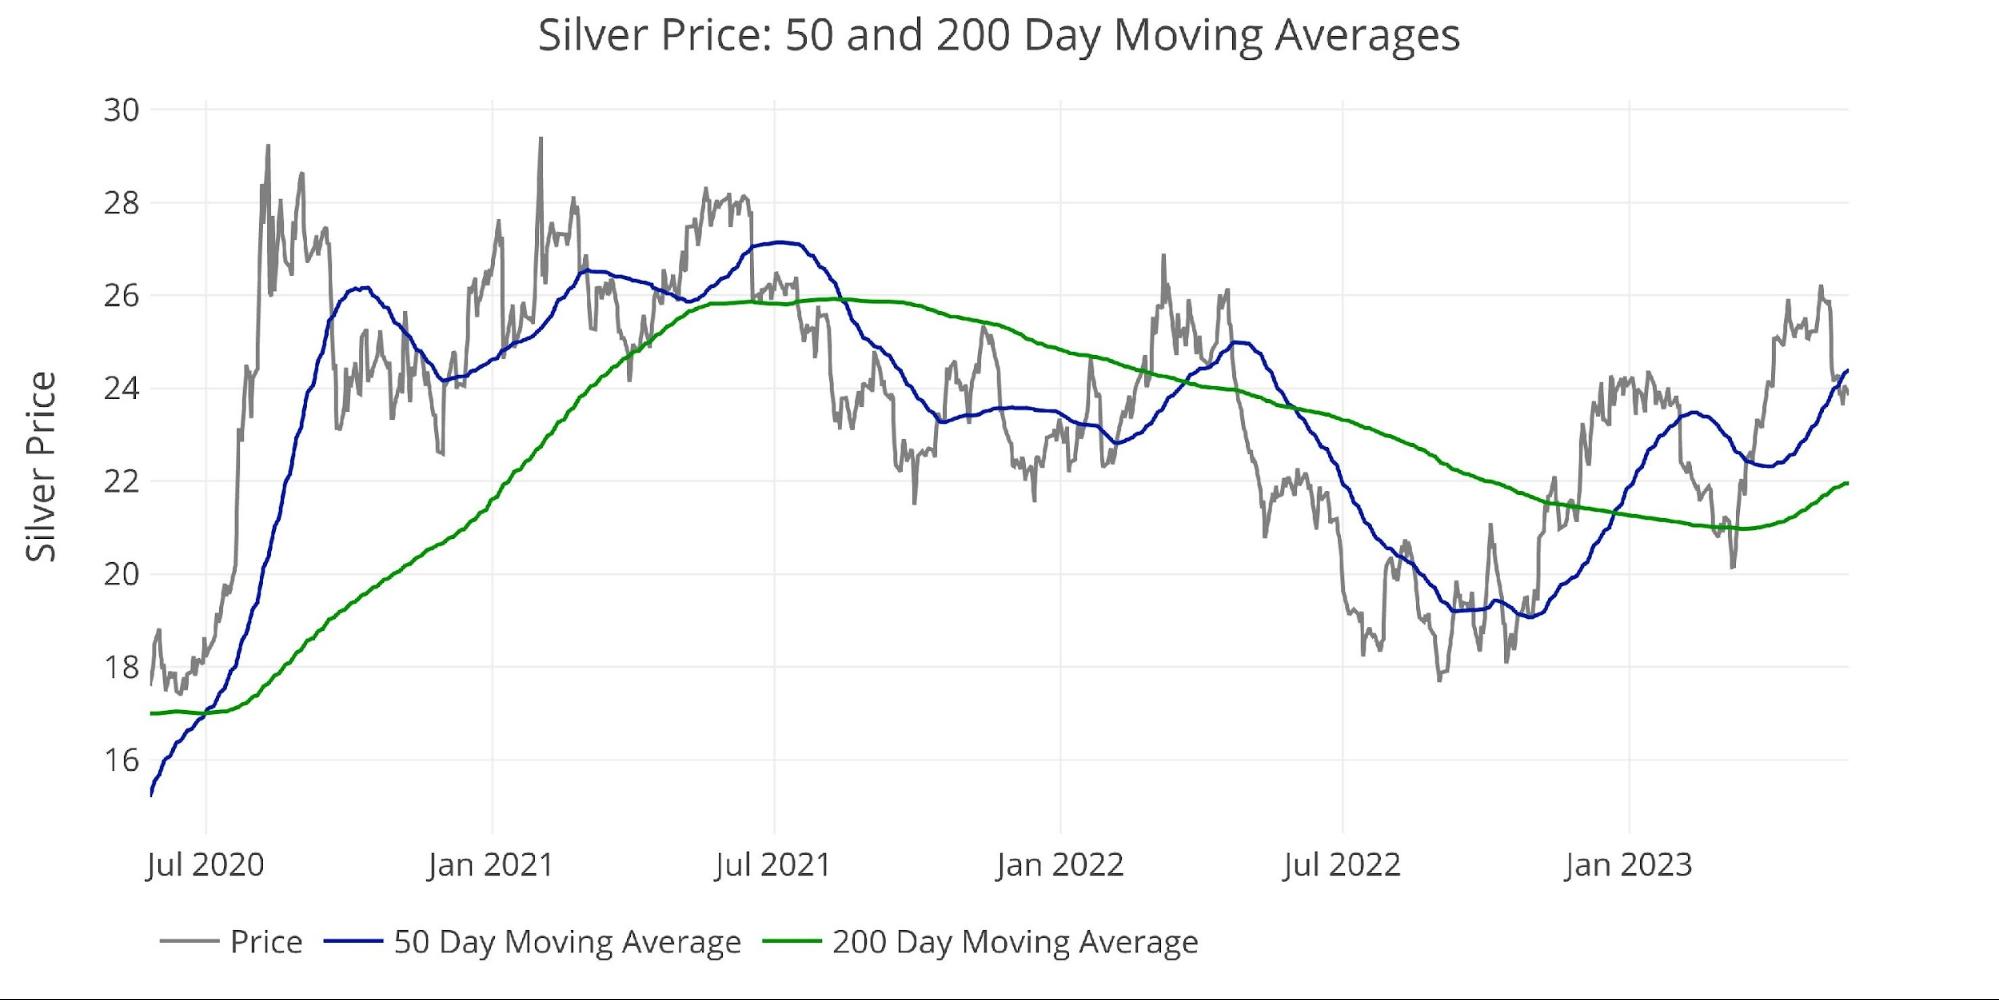
Figure: 3 Silver 50/200 DMA
Comex Open Interest
Gold
The latest action shows that the price rose before the spec traders got behind the move. They climbed on board late in the move but could not get gold to new all-time highs. They then rushed for the exit which really pummeled the price. Open interest could definitely fall further, but it’s closer to a bottom than a top. Either way, this chart is not as bullish as last month when the entire move seemed to be independent of the futures market.
Outlook: Neutral
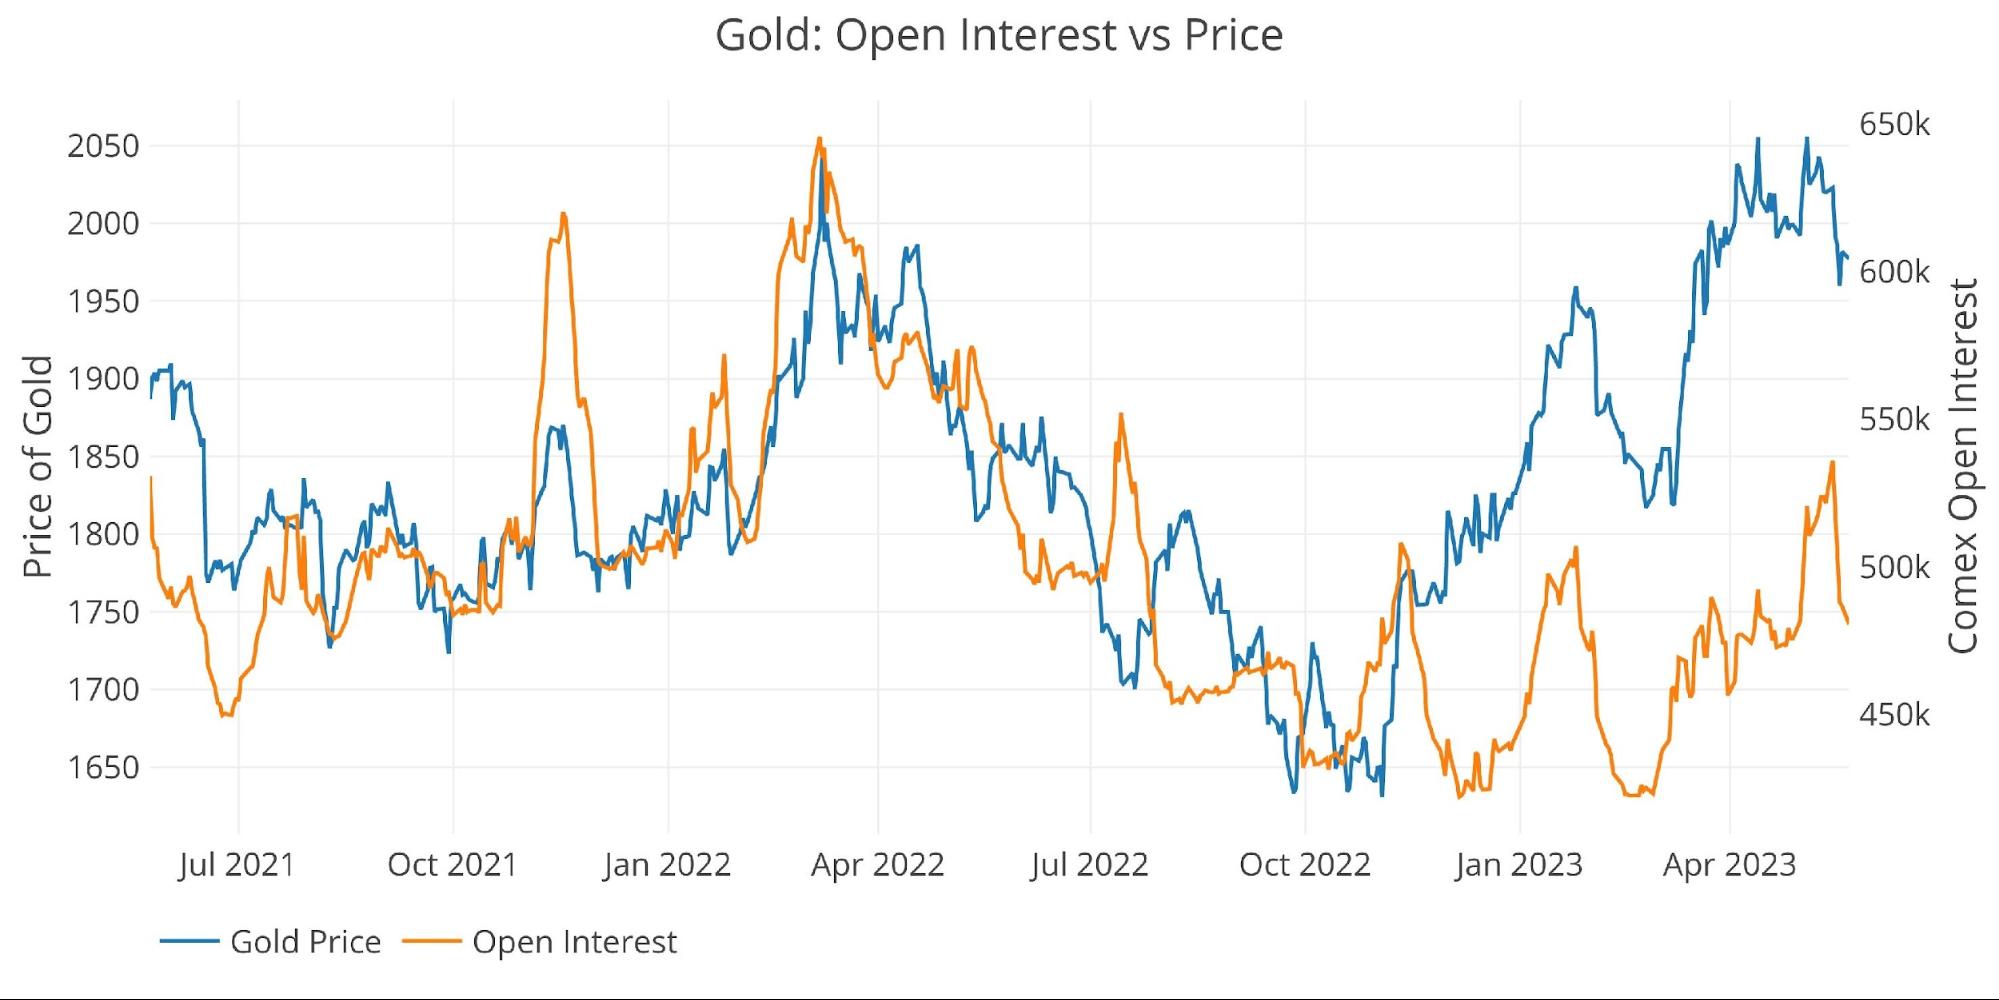
Figure: 4 Gold Price vs Open Interest
Silver
The price of silver is still well above where it was when open interest was last at this level. That is a bullish sign suggesting the worst might be over in silver. While open interest is not at the recent lows, it is near enough that downside should be limited. This gives more potential to the upside.
Outlook: Slightly bullish
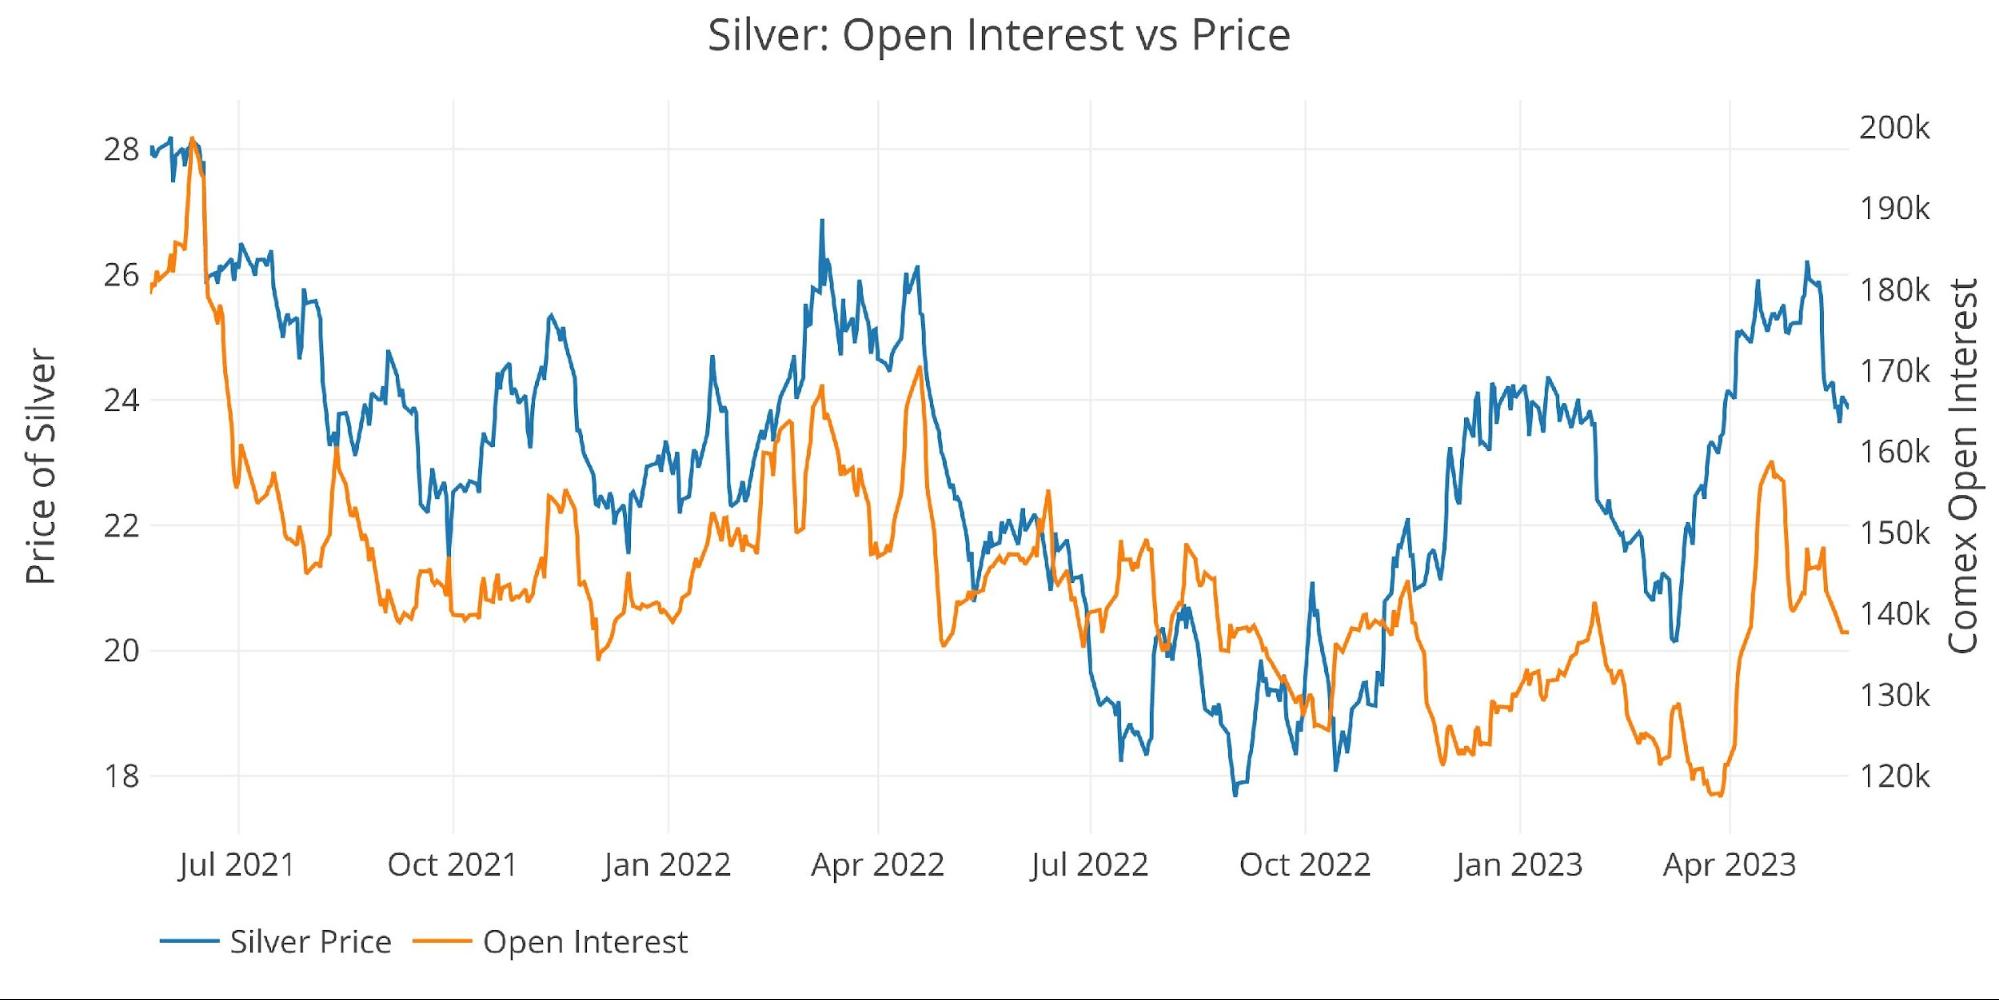
Figure: 5 Silver Price vs Open Interest
Margin Rates and Open Interest
Gold
Margin rates have been steadily rising since November last year. Rates are now up $2600 in 5 months. This is a very big move (increase of 50%) but it was not the reason for the price drop (though it could have exacerbated it)
With rates higher, the CFTC has less room to pressure the market down if the price does snap back on the next market catalyst.
Outlook: Bullish
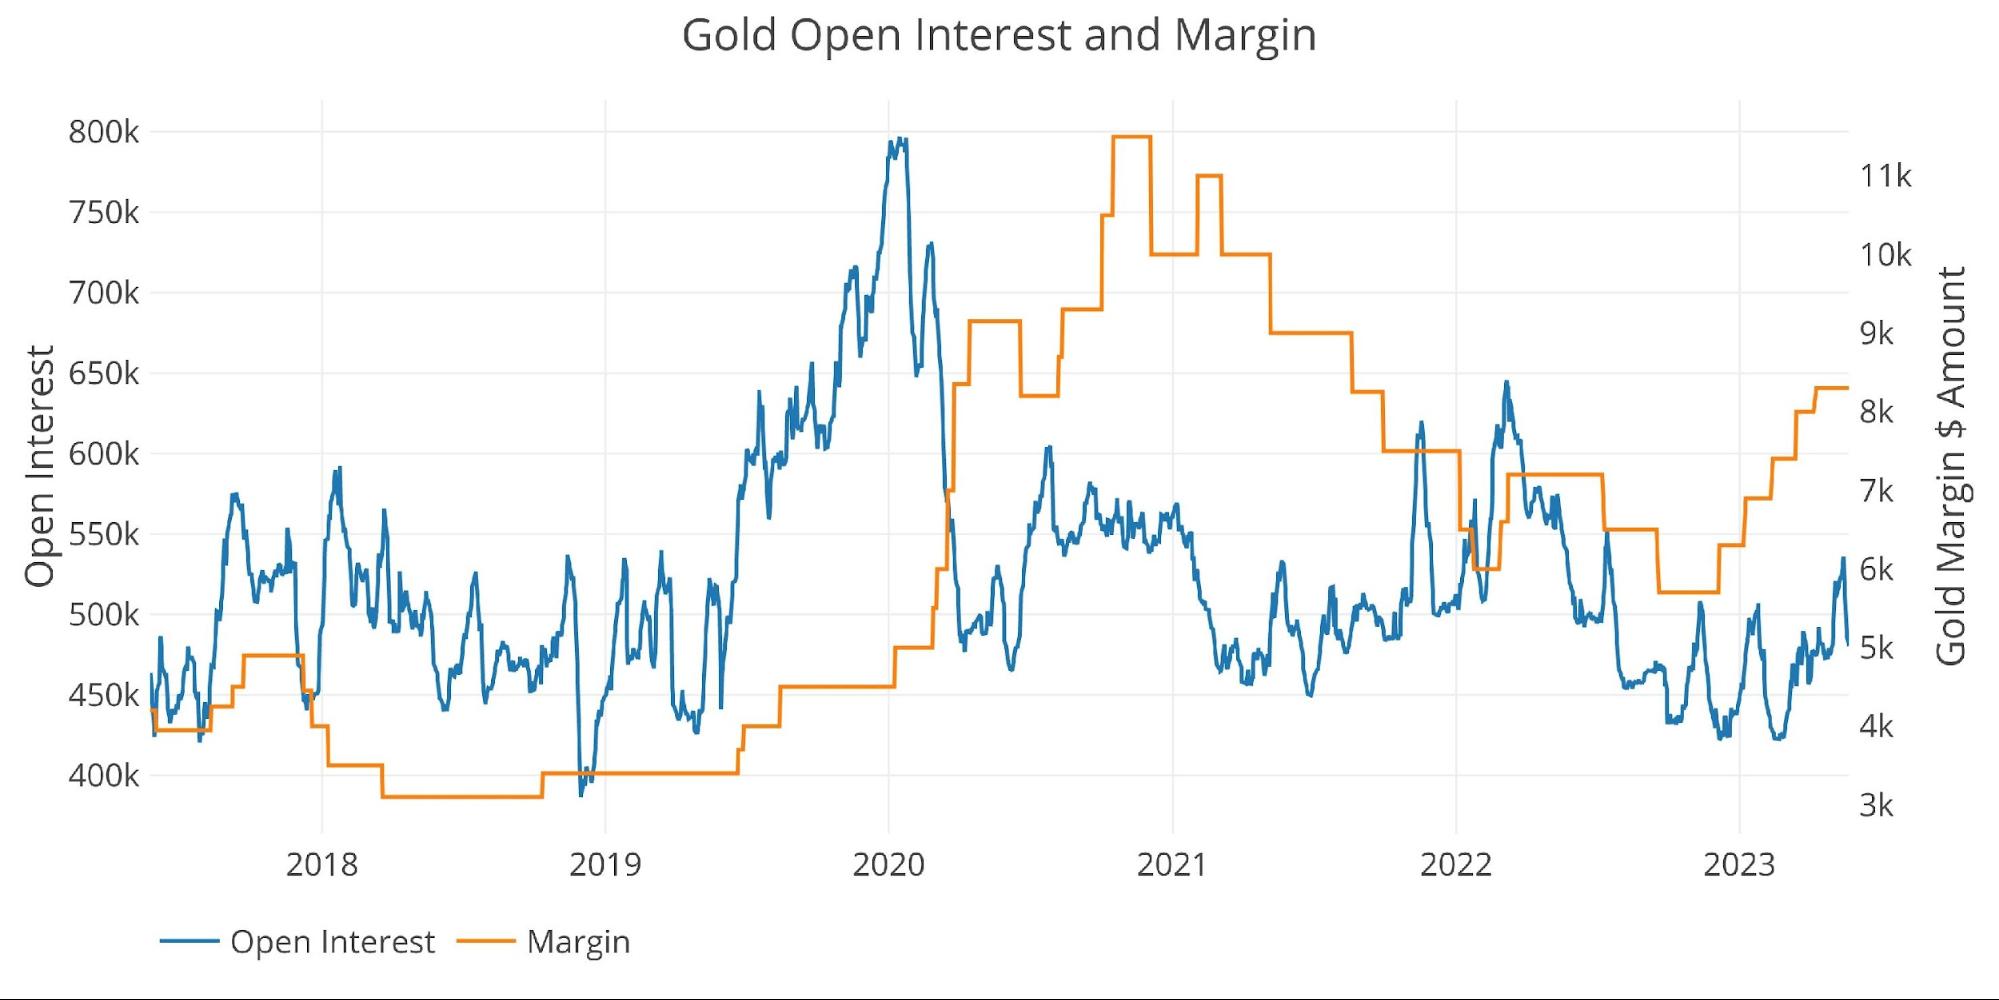
Figure: 6 Gold Margin Dollar Rate
Silver
With the recent spike in open interest combined with the smaller increases in margin rates, the CFTC now has much more ability to contain this market. The CFTC has a lot of room to push margin rates higher and a new cohort of weak holders to push out.
Outlook: Bearish

Figure: 7 Silver Margin Dollar Rate
Gold Miners (Arca Gold Miners Index)
The gold miners have been consistently leading the price of gold in both directions for years. That was no different two weeks ago when the miners got absolutely crushed, gold stayed strong for a few more days before giving way, but no question the miners led the move.
Right now, the miners have still been under pressure suggesting that weakness in gold will continue.
Outlook: Bearish
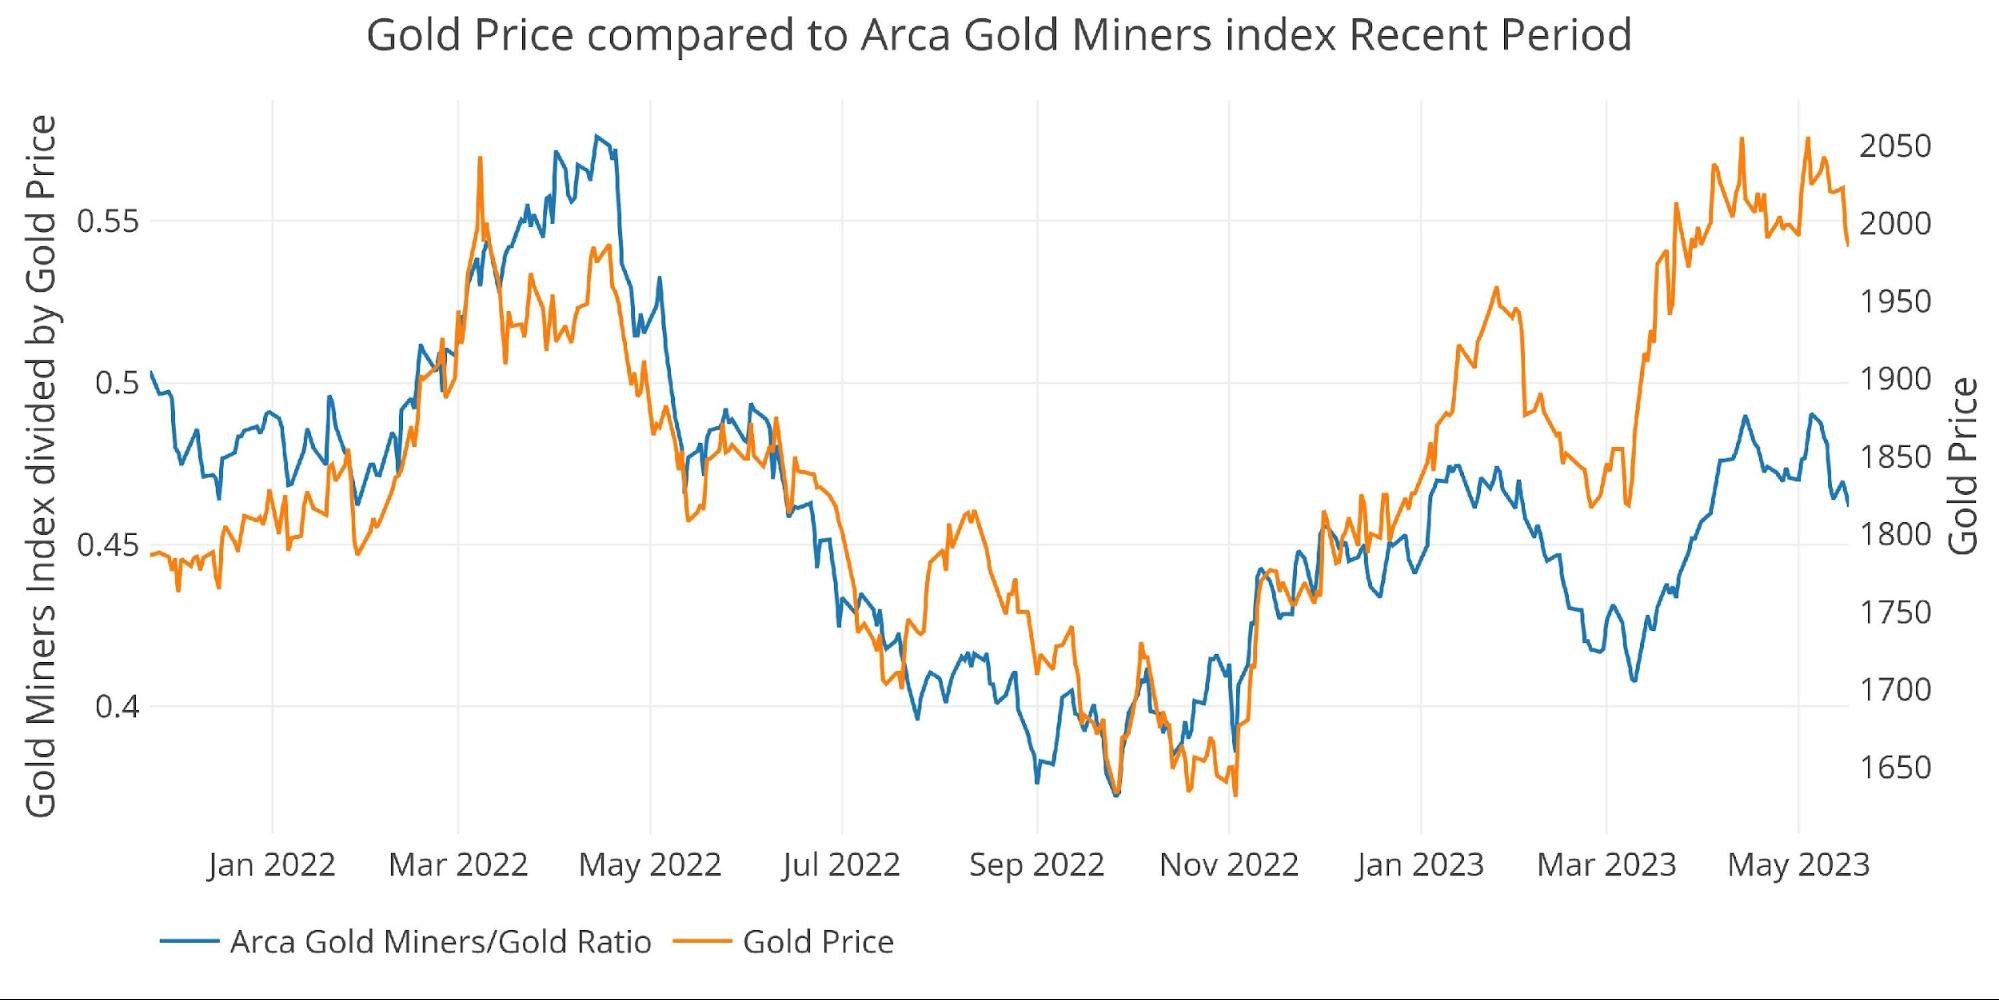
Figure: 8 Arca Gold Miners to Gold Current Trend
The chart below shows the longer-term historical relationship. The miners have been absolutely punished over the last decade as stock traders have never bought into the current move in gold. That leaves these stocks deeply undervalued and set up for an explosive move when the gold price takes off.
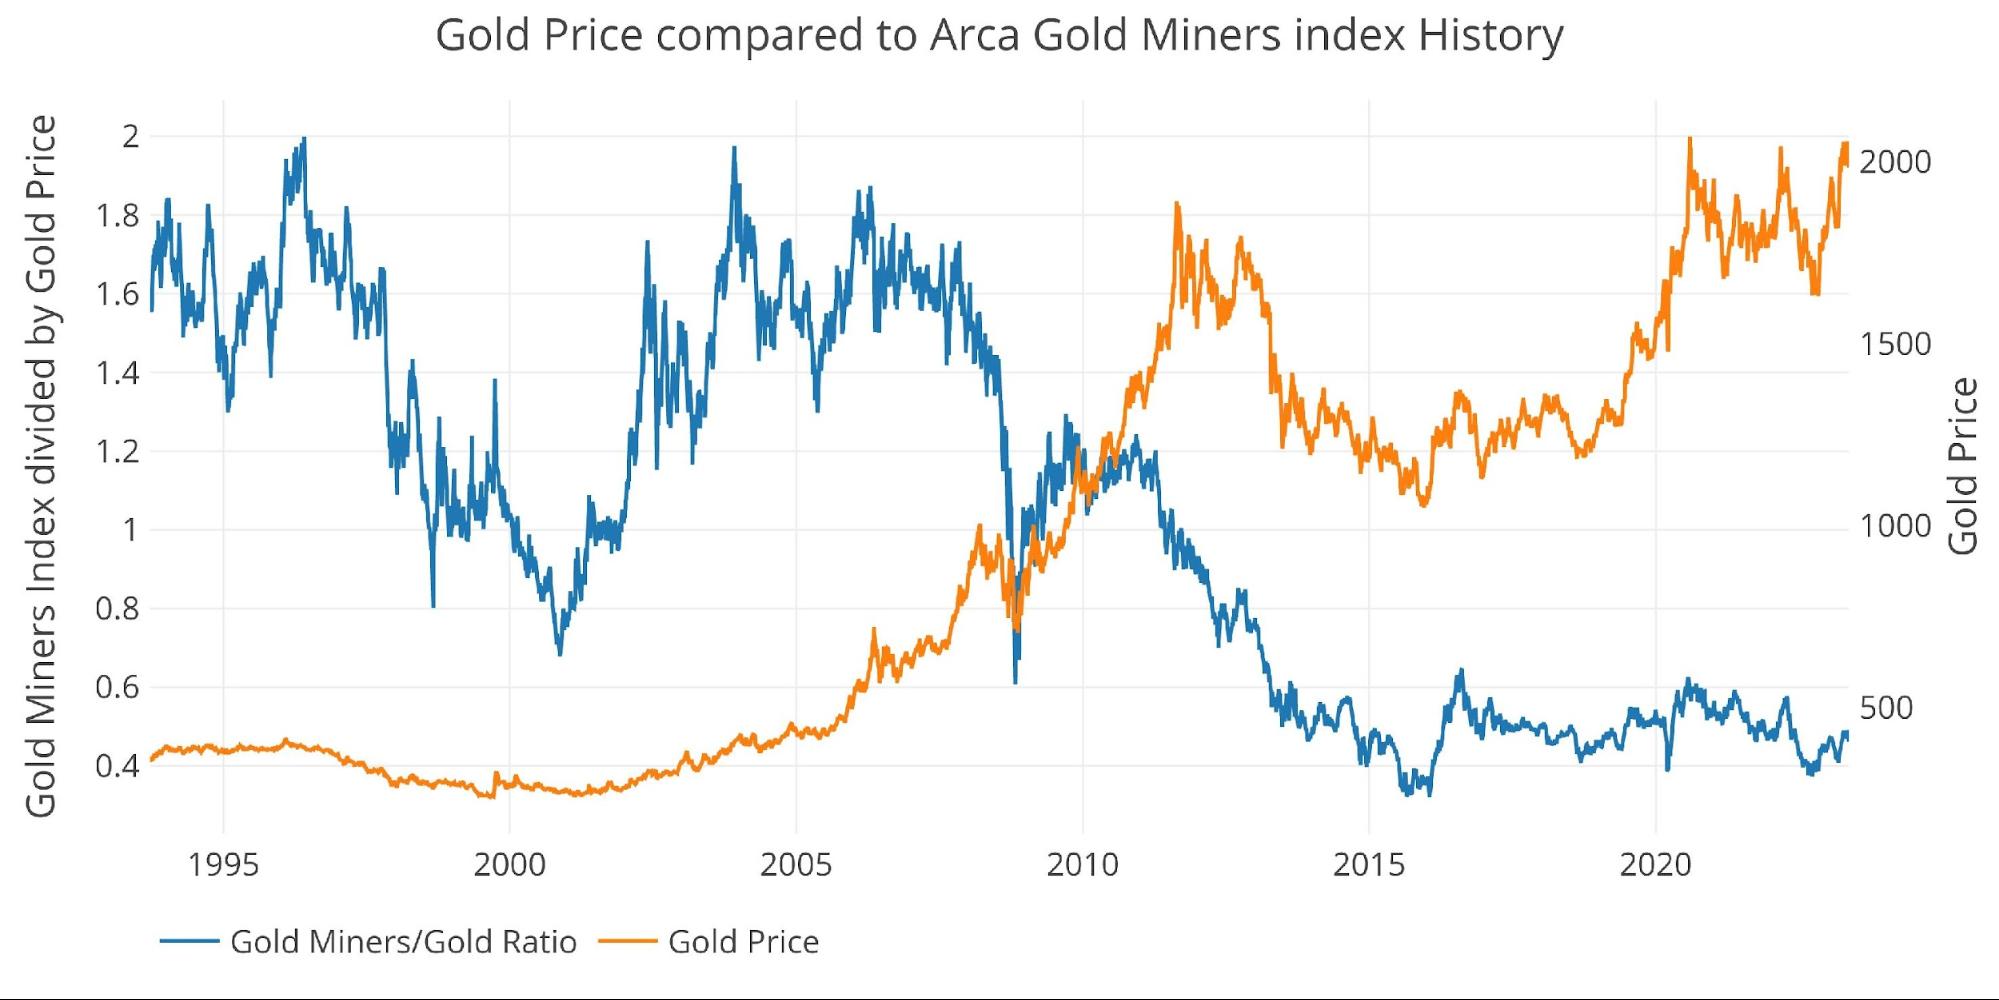
Figure: 9 Arca Gold Miners to Gold Historical Trend
Trade Volume
Love or hate the traders/speculators in the paper futures market, but it’s impossible to ignore their impact on price. The charts below show more activity tends to drive prices higher.
Volume in gold has been down and shorts have capitalized on the lower volume. The low volume over the last few weeks suggests that there could be a pop coming in the near term.
Outlook: Slightly Bullish
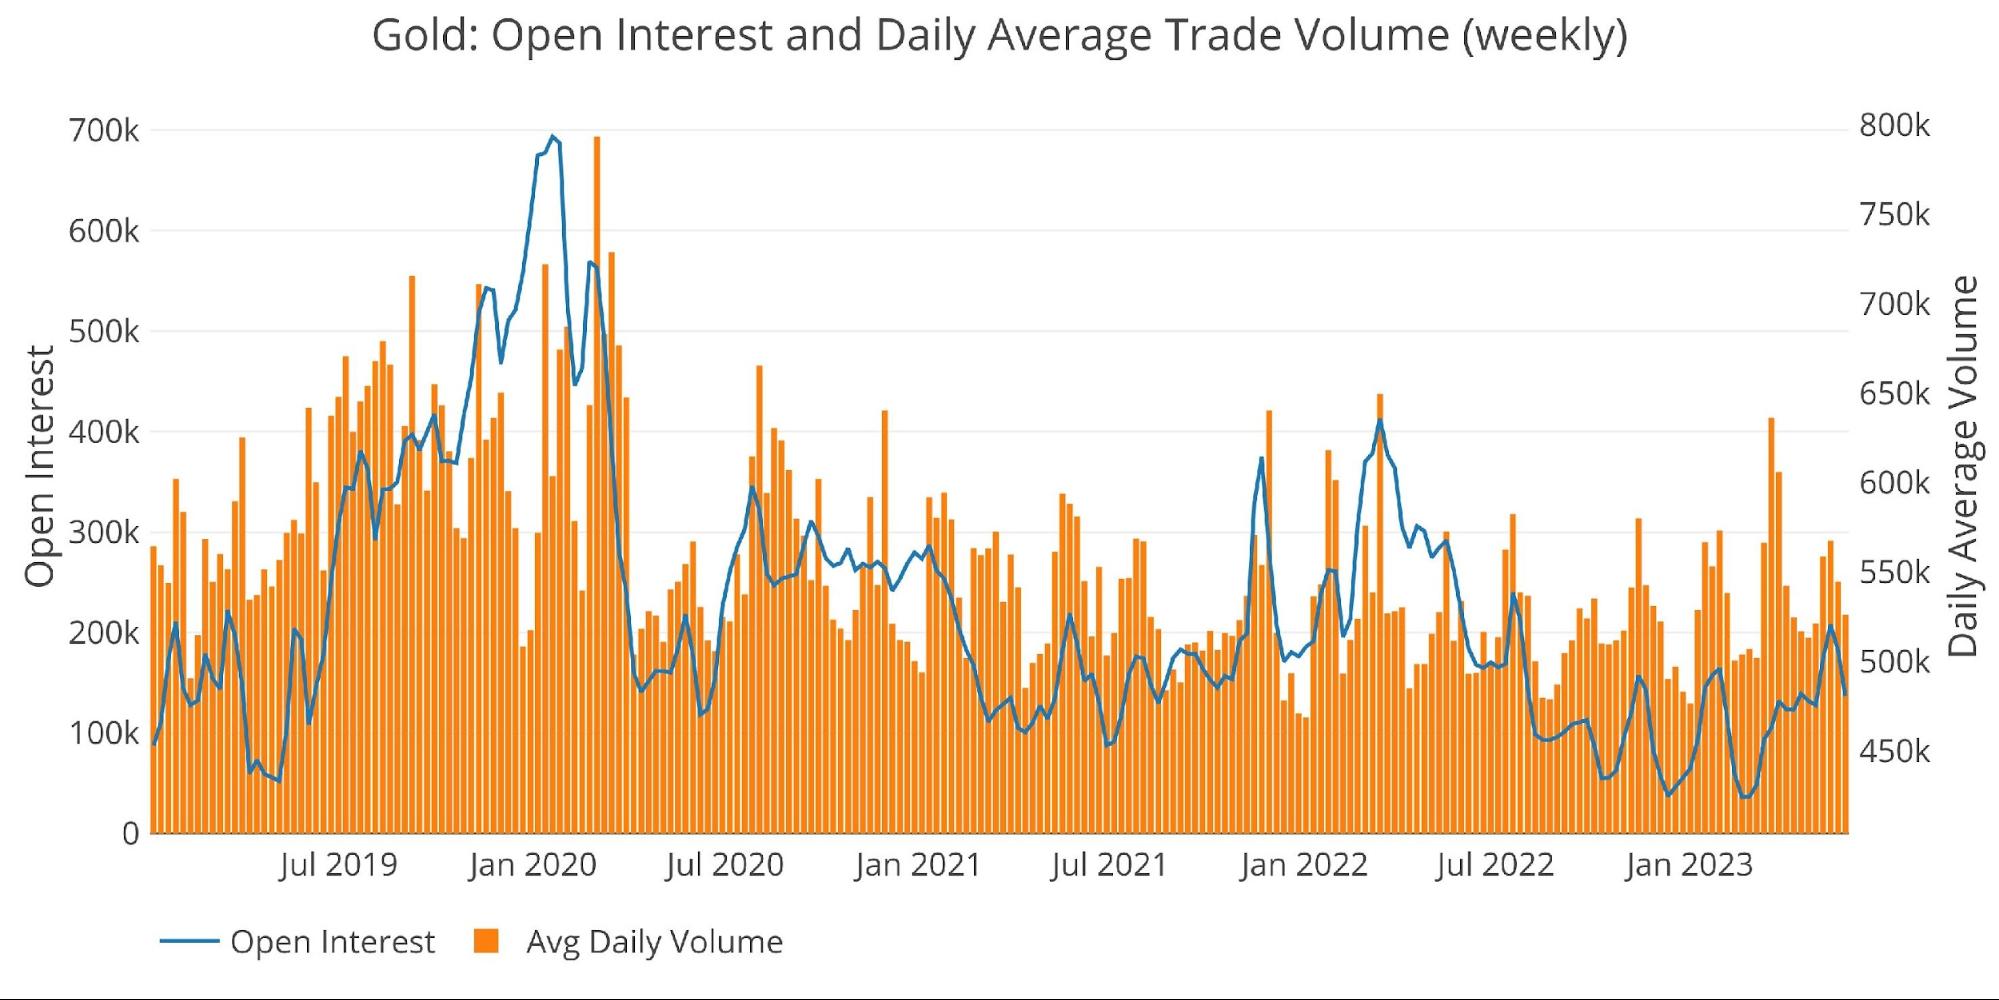
Figure: 10 Gold Volume and Open Interest
Silver is once again similar to gold. It is waiting to see volume spike to break through recent highs.
Outlook: Slightly Bullish
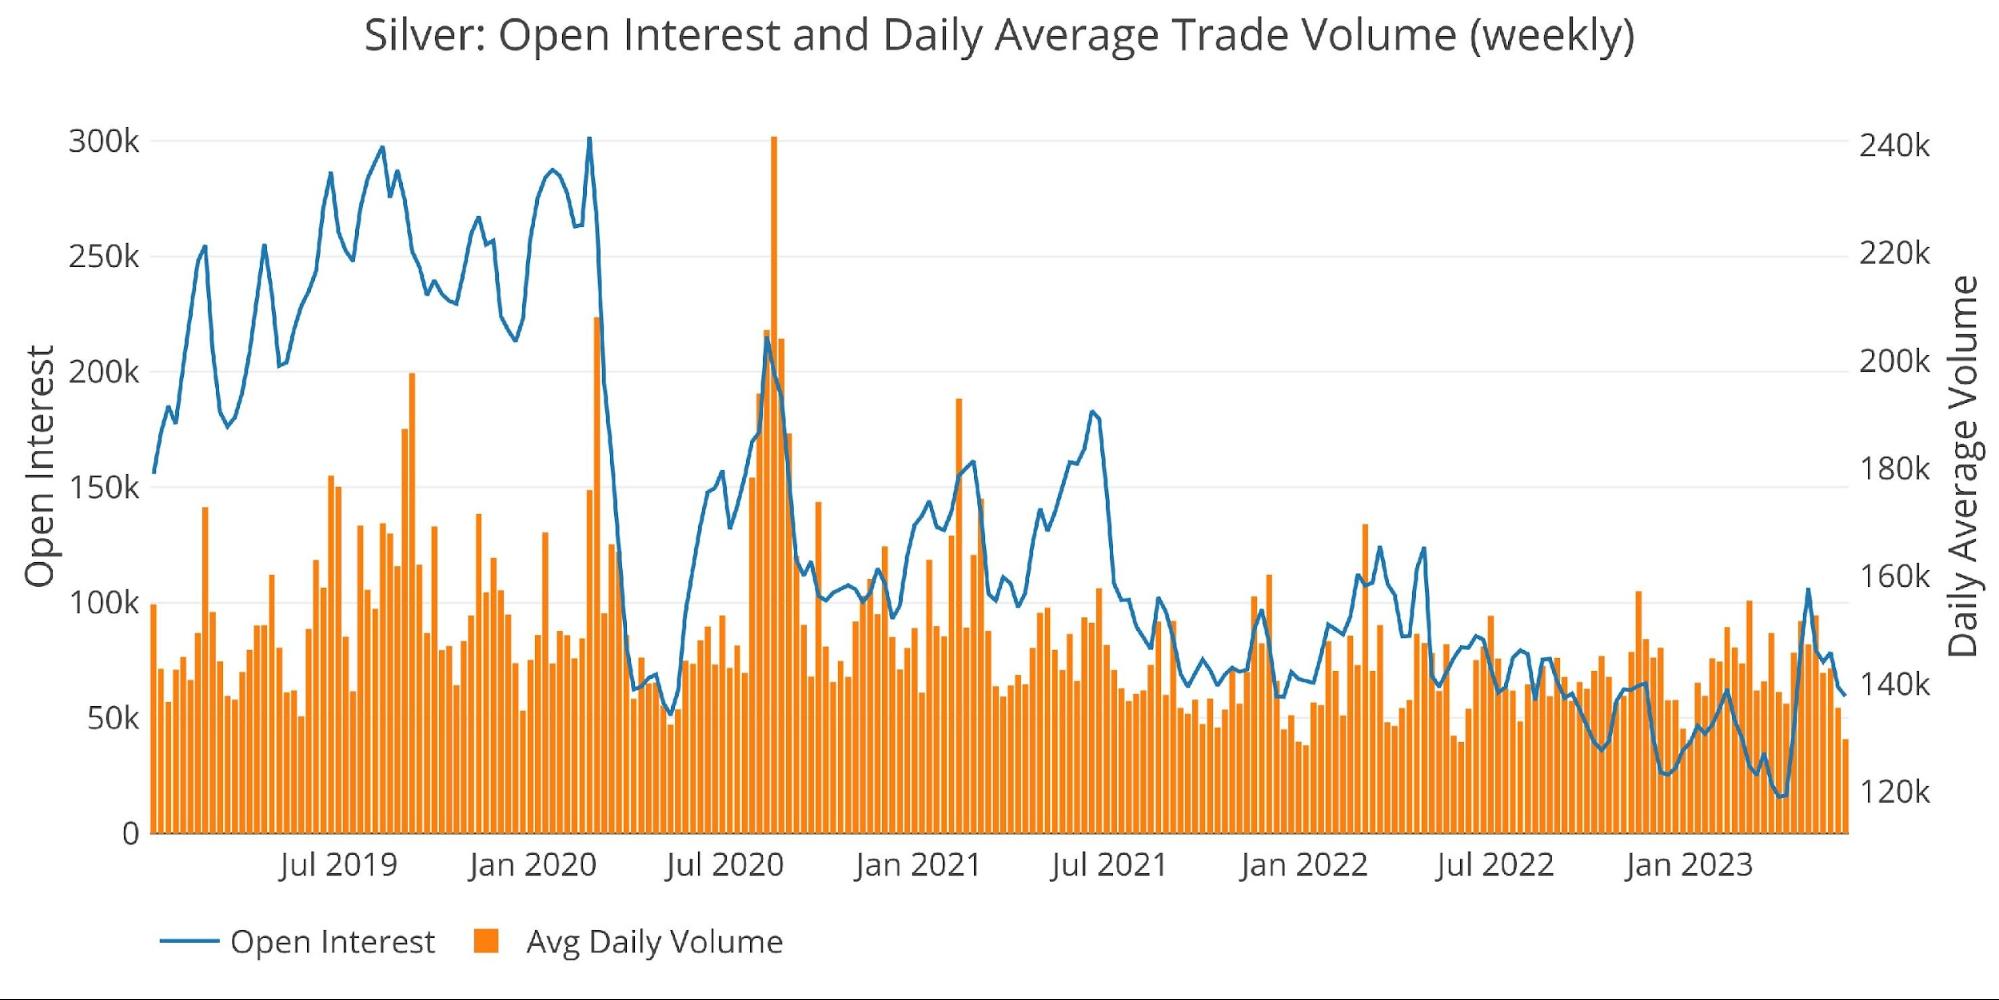
Figure: 11 Silver Volume and Open Interest
Other drivers
USD and Treasuries
Price action can be driven by activity in the Treasury market or the US Dollar exchange rate. A big move up in gold will often occur simultaneously with a move down in US debt rates (a move up in Treasury prices) or a move down in the dollar.
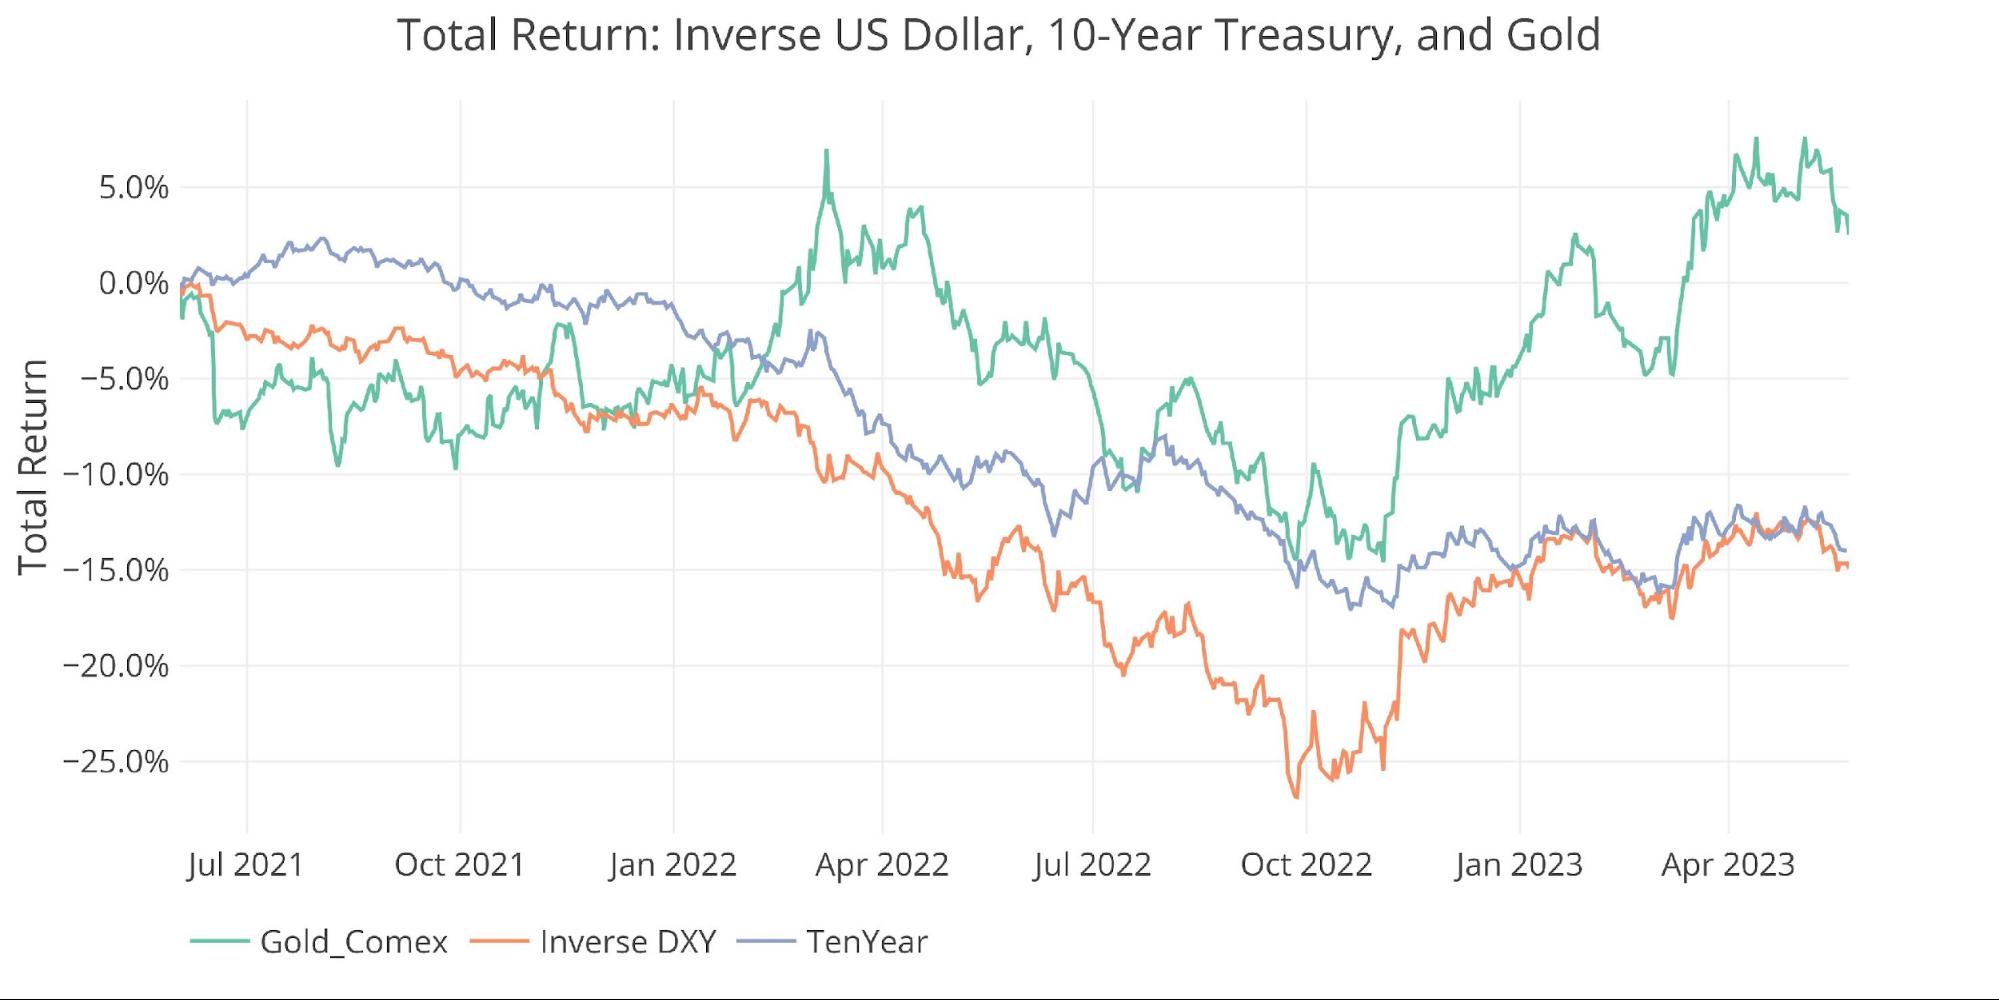
Figure: 12 Price Compare Inverse DXY, GLD, 10-year prices
The dollar, bonds, and gold are all moving in tandem at the moment as shown above. This suggests that there is no mispricing across products. It will likely take another pullback in the dollar before gold can climb higher.
Outlook: Neutral to bearish
Gold Silver Ratio
The gold-silver ratio has turned back up after seeing a big turnaround with the blistering rise in silver back in April. That said, it’s still above 80 which puts it in silvers favor.
Outlook: Silver bullish relative to gold long-term
(Click on image to enlarge)
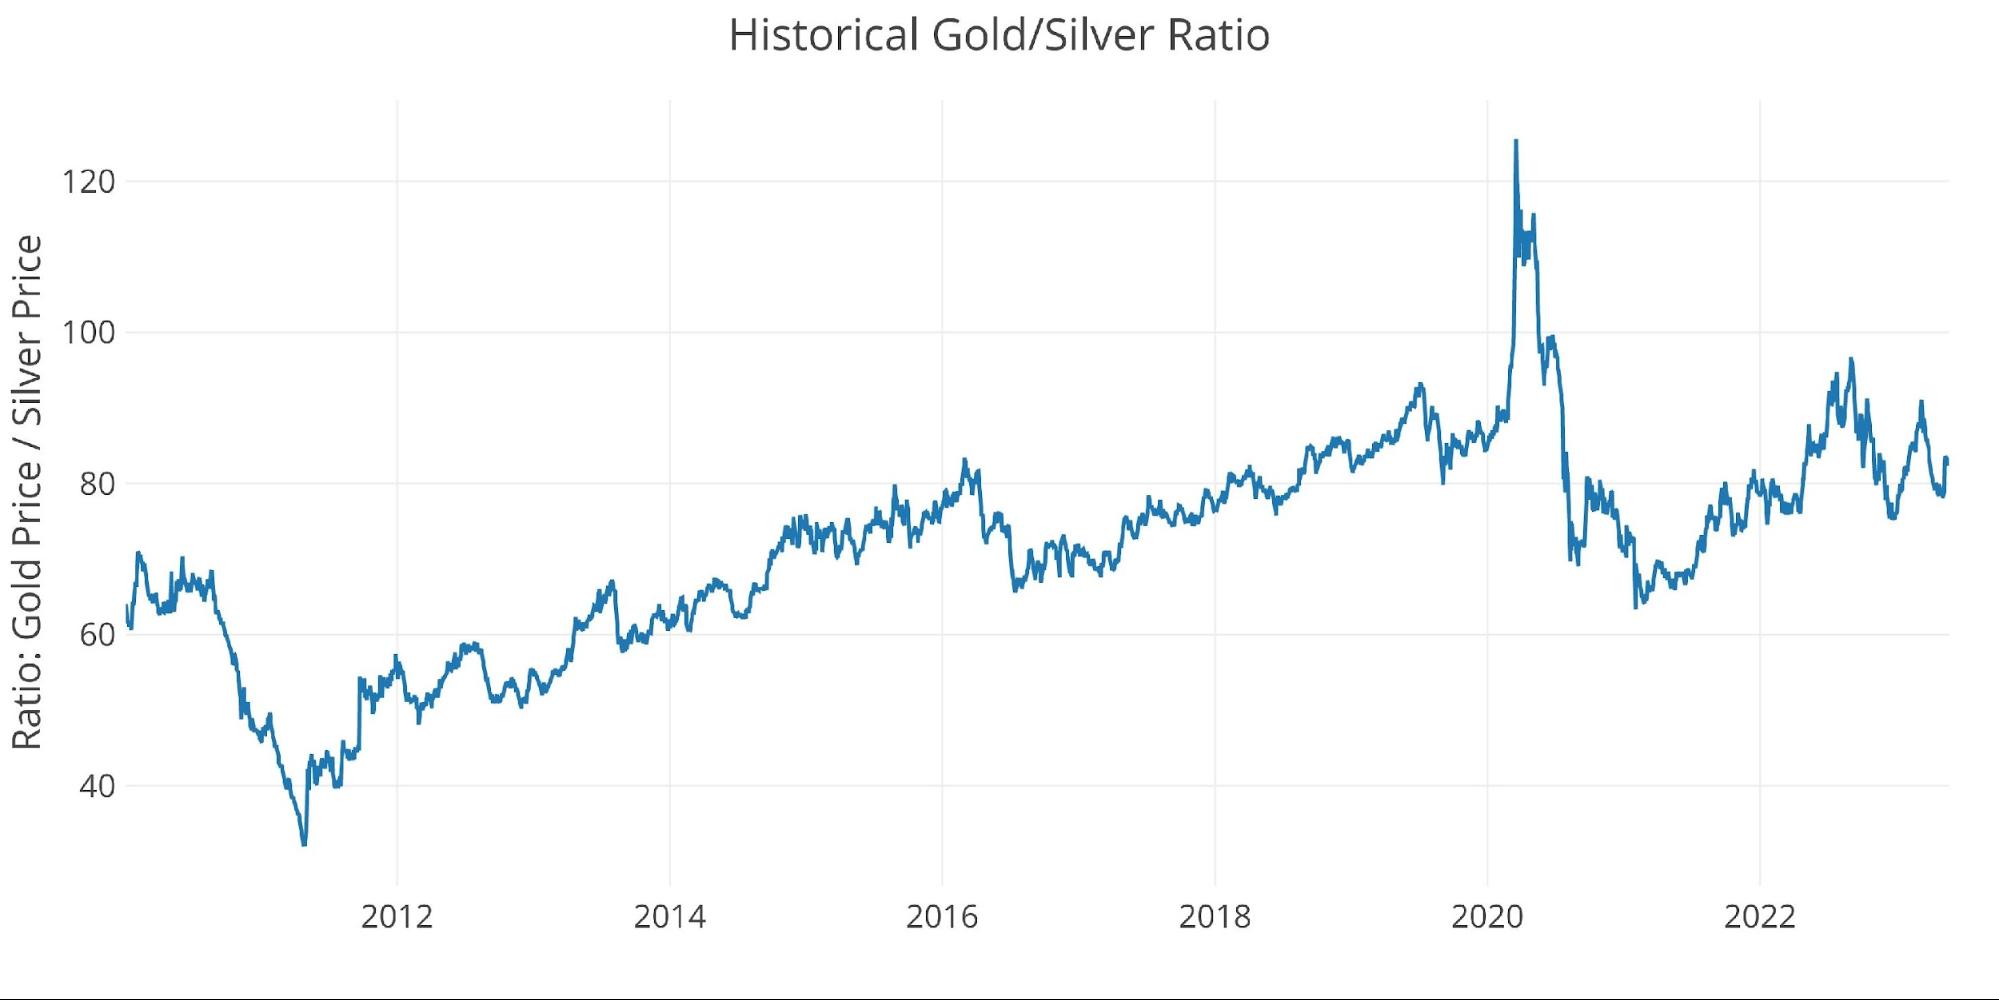
Figure: 13 Gold Silver Ratio
Bringing it all together
The table below shows a snapshot of the trends that exist in the plots above. It compares current values to one month, one year, and three years ago. It also looks at the 50 and 200-daily moving averages. While DMAs are typically only calculated for prices, the DMA on the other variables can show where the current values stand compared to recent history.
-
- Open interest in gold has actually increased despite the price being lower. This shows that the move up was not driven by futures, but the way down was driven by futures.
-
- Gold’s open interest is above the 50 DMA and 200 DMA OI which means there could be more selling
-
- Silver has fallen quite dramatically across all the metrics
-
- Compared to a year ago though, open interest is lower but the price is higher
-
- Open interest in gold has actually increased despite the price being lower. This shows that the move up was not driven by futures, but the way down was driven by futures.
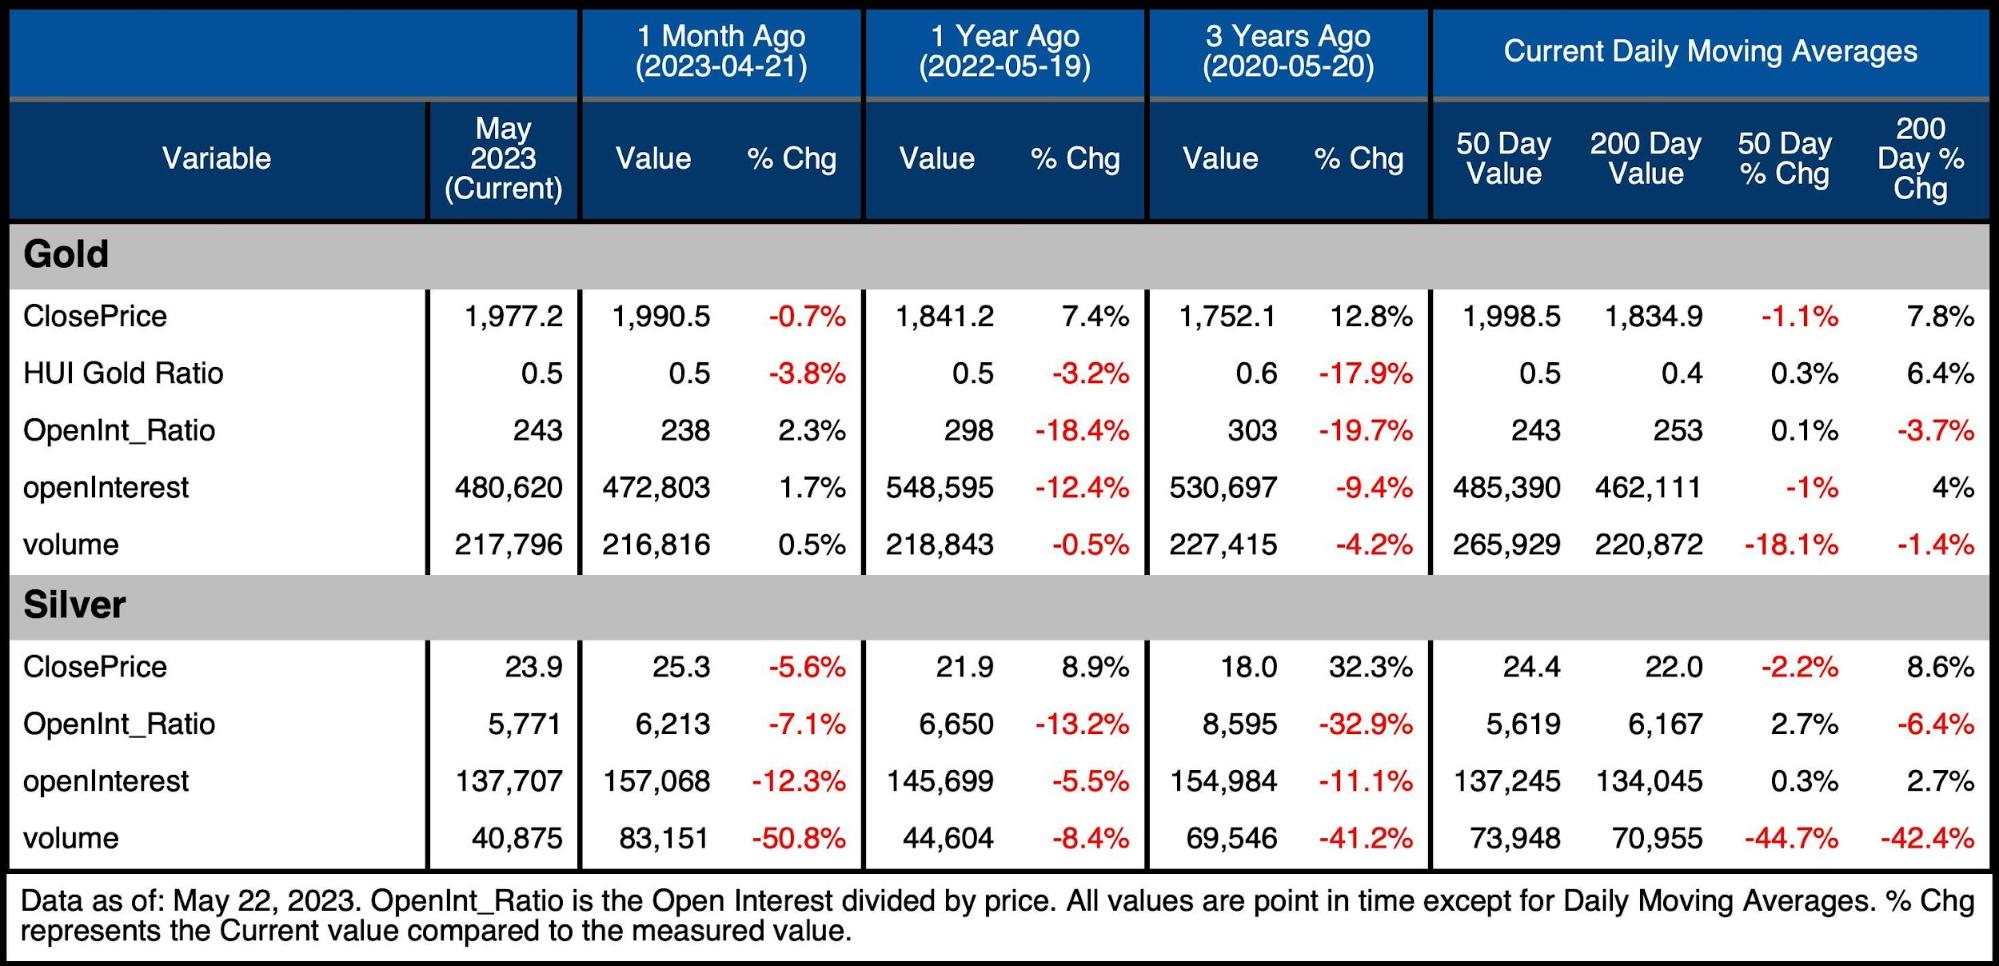
Figure: 14 Summary Table
Wrapping up
Once fundamentals failed to take gold to new all-time highs, it was only a matter of time before a pullback was seen. The price action had just gotten too far ahead of itself.
The indicators are now mostly neutral with a bearish lean. There are some slightly bullish indicators, but nothing strong enough to give a clear signal. This suggests the price could drift lower until it finds the right catalyst to reverse. There should be plenty of catalysts on the horizon, but the biggest one will be how the Fed responds to the next crisis.
Until then, pressure is pointing downward.
Data Source: https://www.cmegroup.com/ and fmpcloud.io for DXY index data
Data Updated: Nightly around 11 PM Eastern
Last Updated: May 22, 2023
Gold and Silver interactive charts and graphs can be found on the Exploring Finance dashboard: https://exploringfinance.shinyapps.io/goldsilver/
More By This Author:
Poland Resumes Buying Gold
What Are The Markets Getting Wrong?
Who Has The Gold?

Comments
Log in or sign up to join the conversation.