
The Sun Is Truly Shining For Gold Bugs… And More To Come
What a week it’s been for gold bugs who must be pinching themselves, and perhaps frightened they will wake up and find the price action of the past few days has all been a dream. But dream it isn’t and what we are seeing is precisely what I have been suggesting in my posts on gold over the last few weeks, with the US dollar proving to be the catalyst for gold’s move higher. And here I think it’s worth taking a look at three timeframes covering the daily, weekly and monthly charts to give a full perspective on where gold is heading next.
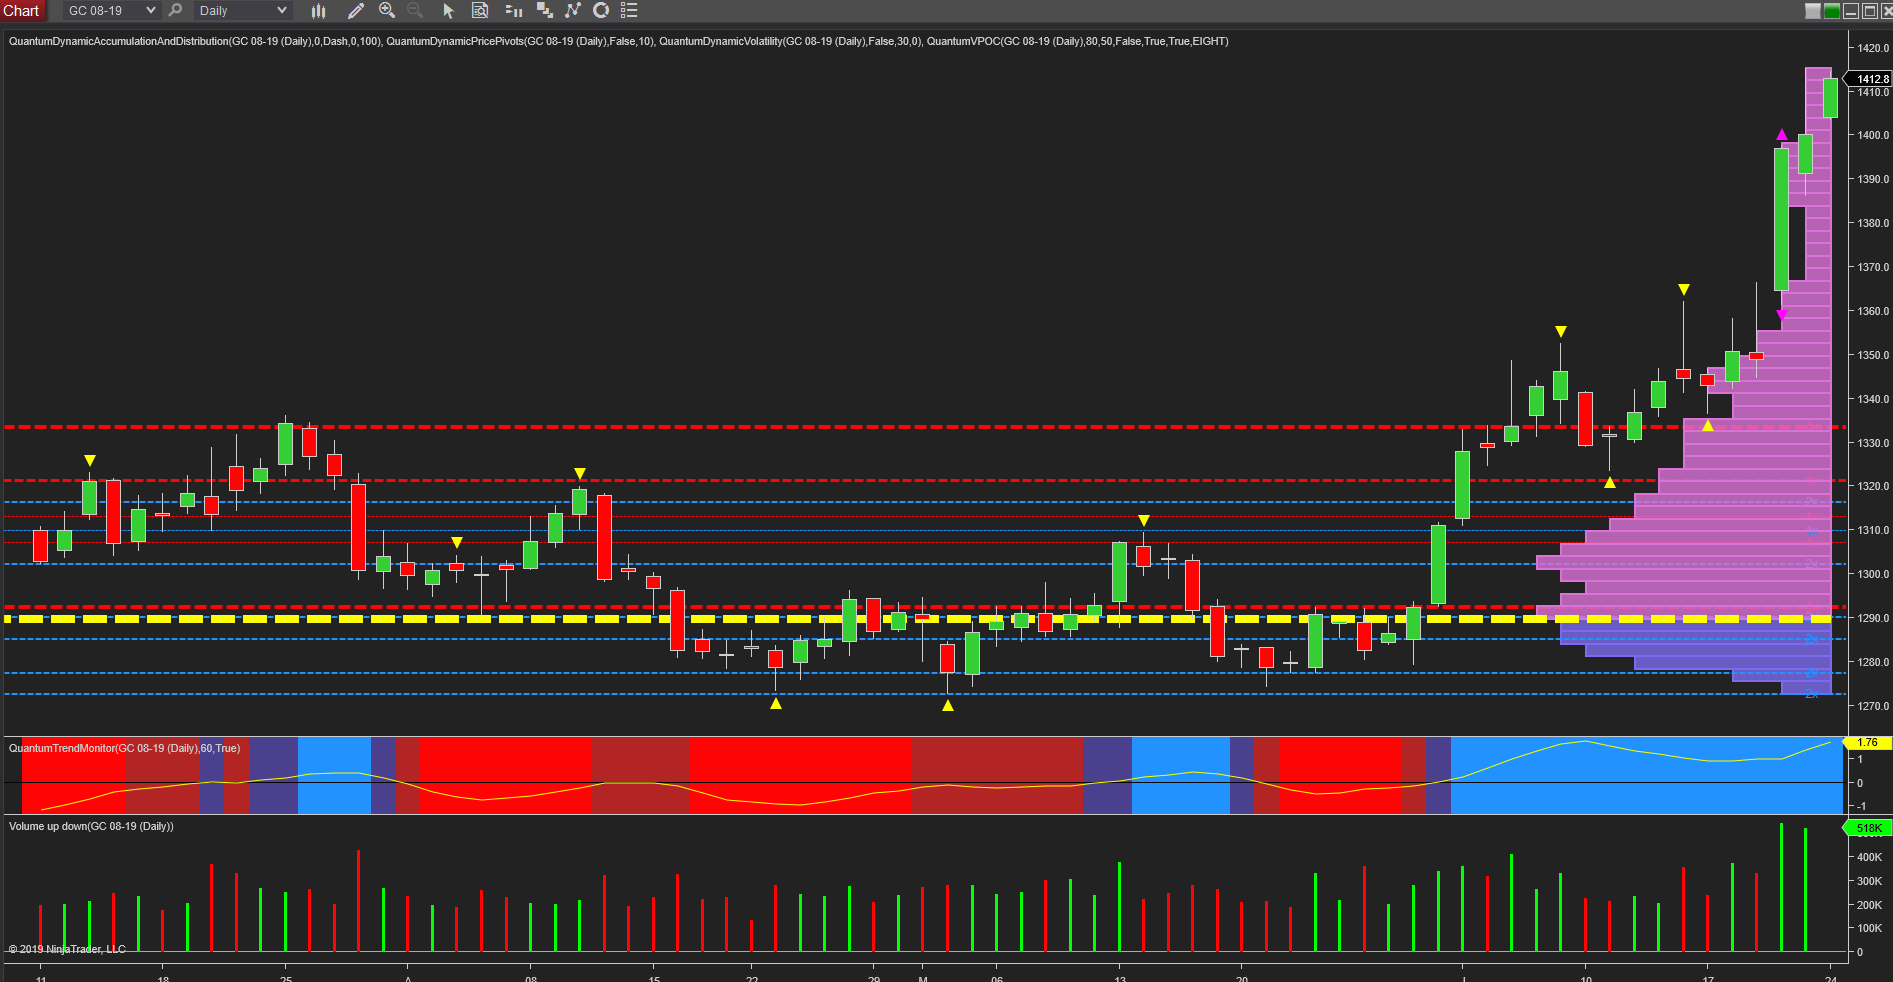
If we begin with the daily chart, it was last Thursday’s price action which caught the imagination, with the metal rising over $35 per ounce on the day on excellent volume, closing with a trigger of the volatility indicator, which signaled congestion to come. This only lasted one day, and whilst the market opened gapped down, the day closed higher and gold ended the week at $1400.1 per ounce. This very bullish momentum has continued in today’s early trading with the precious metal opening gapped up once more and trading at $1412.80 per ounce at the time of writing and pushing into a low volume node ahead on the volume point of control indicator, so we can expect further gains intraday. Volume on the VPOC indicator is extremely light in this area meaning there is little in the way of technical resistance to hinder progress. Notice also on the daily chart the trend monitor indicator which has remained steadfastly blue throughout June and confirming the positive picture for gold.
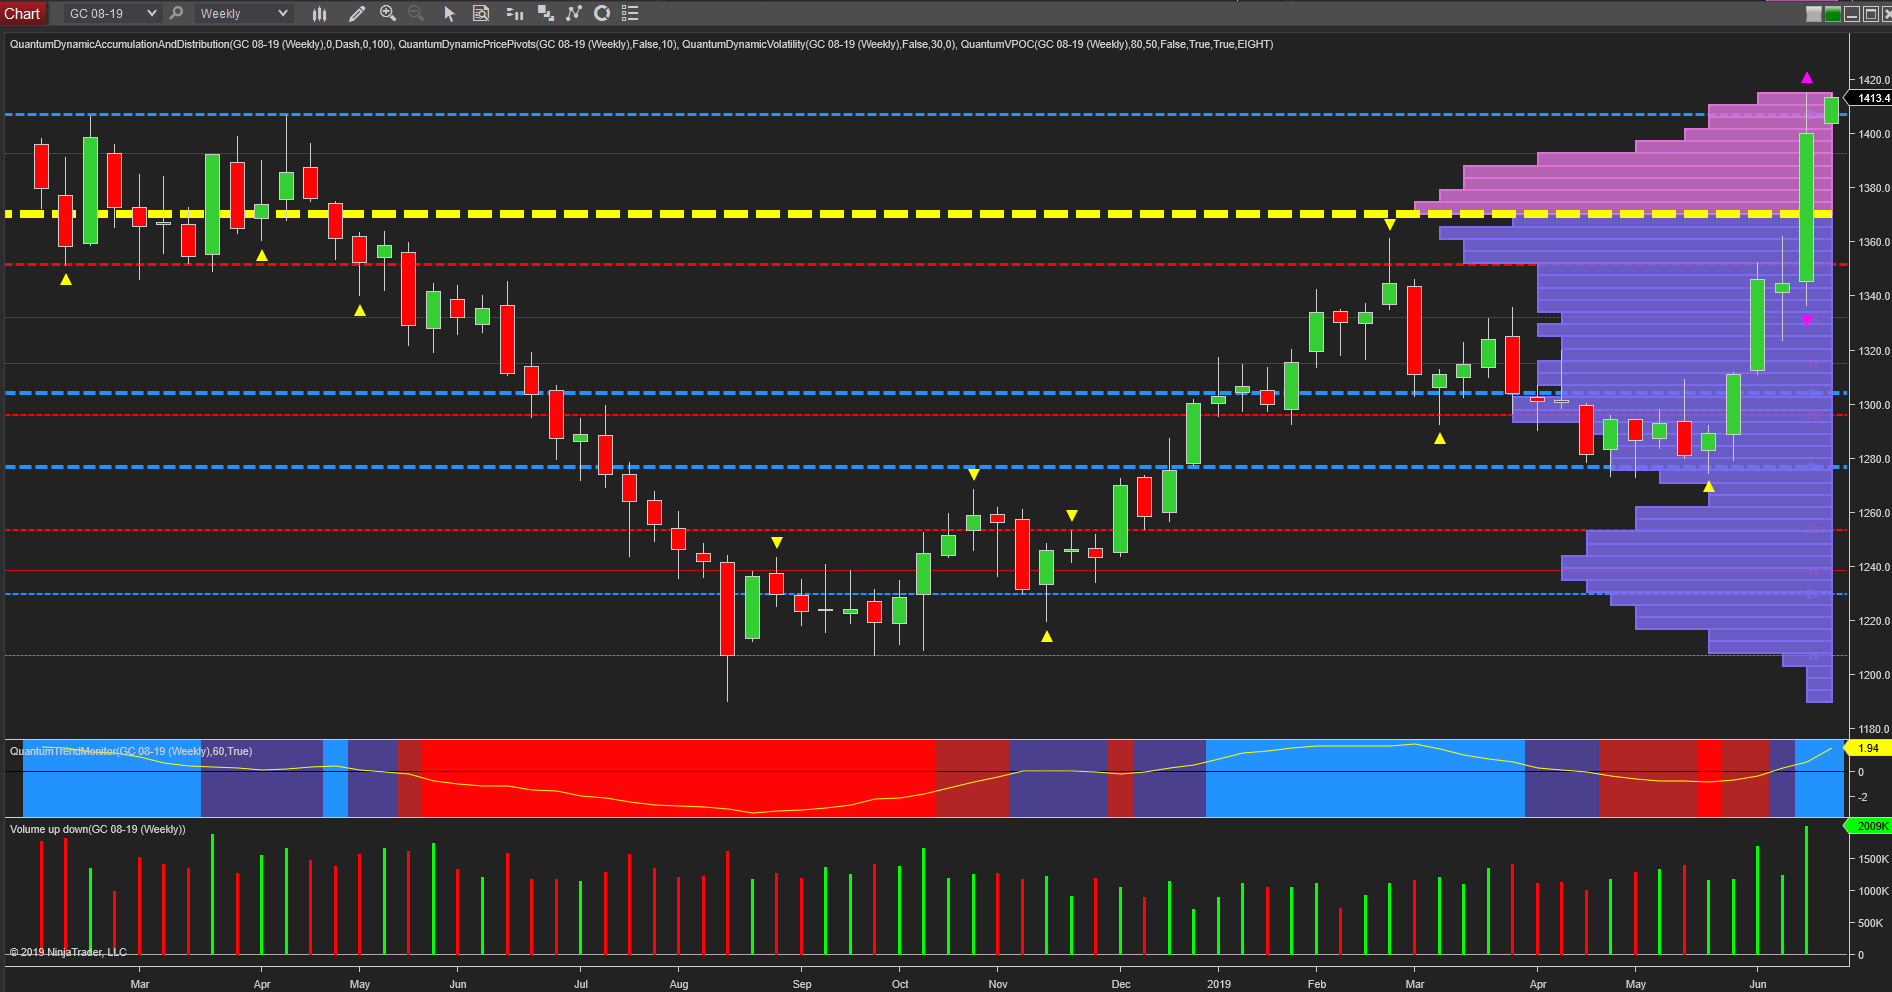
Next comes the weekly chart which is certainly interesting as here too, we have had the volatility indicator triggered and gold is currently trading within the spread of the candle. However, once clear of this candle, and also the minor resistance level at $1410 per ounce as denoted with the blue dashed line and likely to be breached today, $1420 per ounce then becomes the next logical target. The break of this resistance then provides the precious metal with a good platform of potential support.
Moreover, note last week’s volume which was excellent and also that the trend monitor indicator has also transitioned to blue on this timeframe reflecting the bullish sentiment. Below, we have the volume point of control itself denoted with the yellow dashed line which has defined the fulcrum of the market for so long, extending back to 2014, which is why this month’s breakaway is so significant and such good news for gold bugs! The only downside ahead is the relatively high volume on the vpoc histogram which extends through to $1440 per ounce before falling away as we move towards $1500 per ounce. But if the $1440 per ounce region is breached, we can expect to see this bullish momentum continue on higher, and possibly even up towards the $1500 per ounce area and well beyond, as we finally see an end to the long and extended 5-year congestion phase for the precious metal.
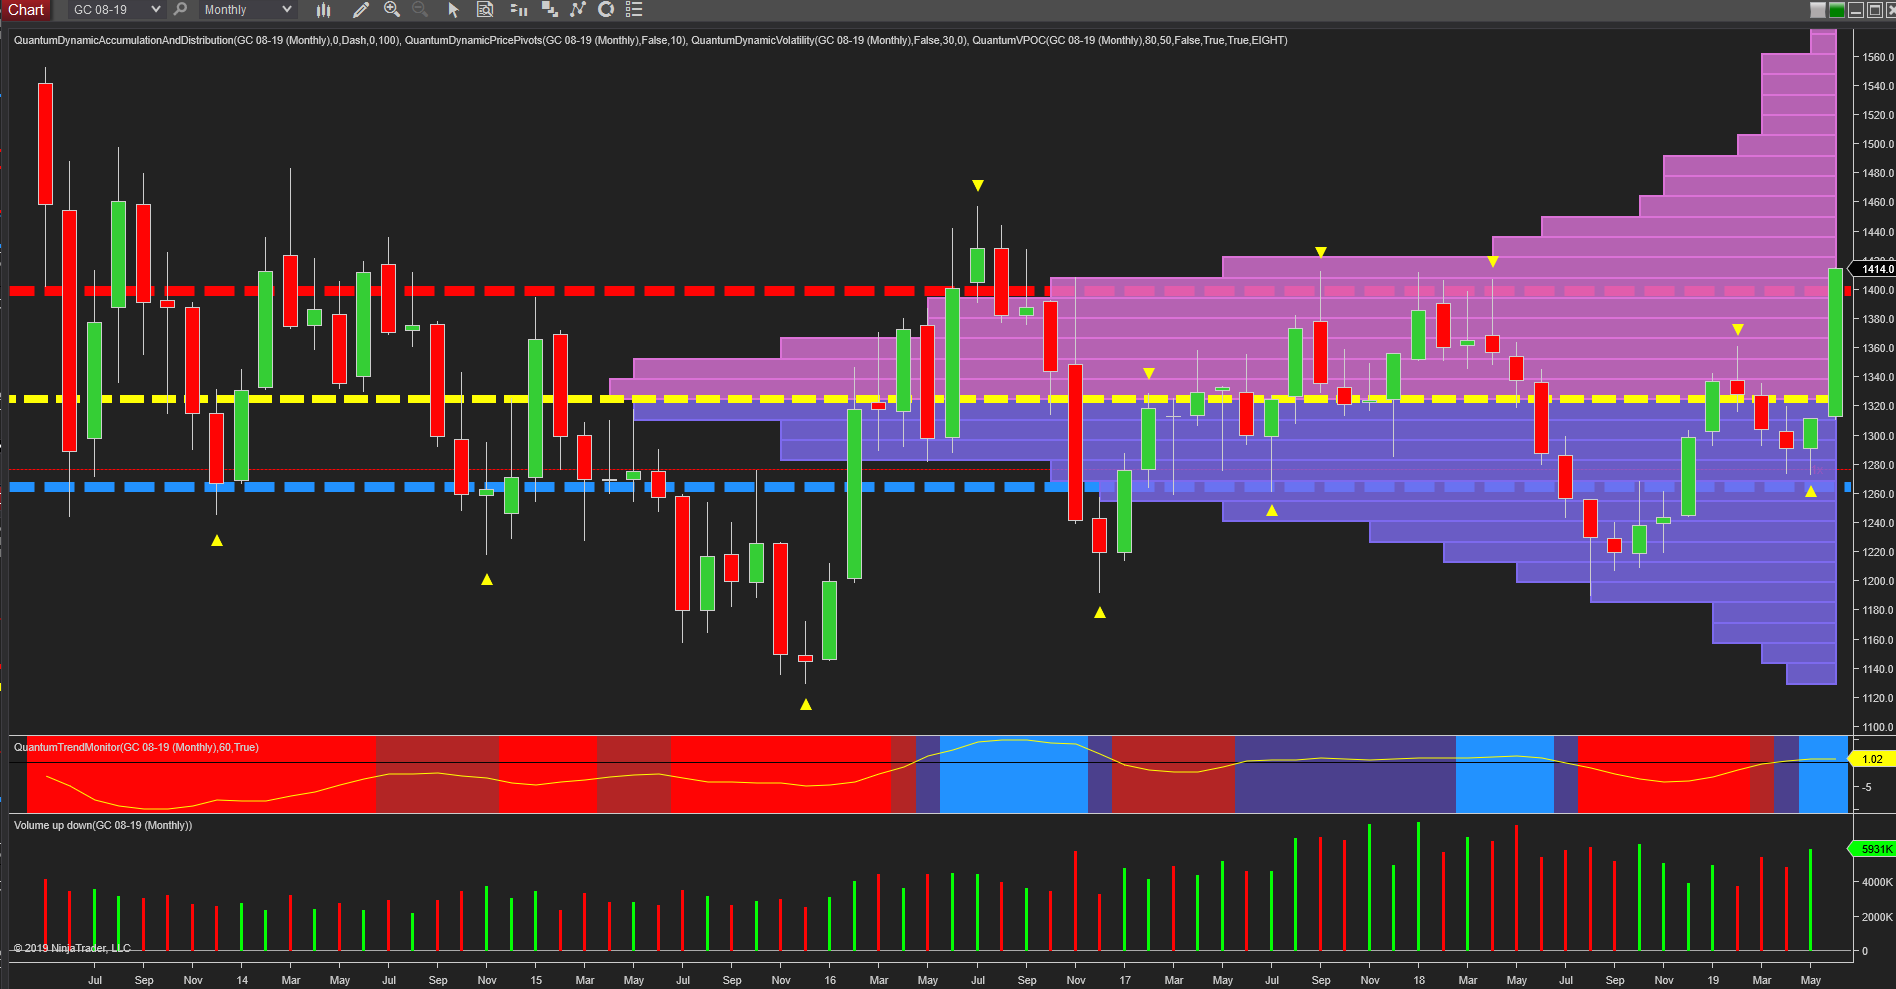
Finally, we come to the monthly chart for the longer term perspective, which again is very positive. First, note the strong resistance denoted with the red dashed line at $1400 per ounce. This is price based resistance on the accumulation and distribution indicator which defines these regions automatically and describes them visually – the thicker the line the deeper that area of resistance or support. Here the line is very wide and is, therefore, signaling that an extremely strong region has now been breached, and assuming gold continues to hold and close above this for the remainder of the month the prospect for gold looks very promising.
Disclaimer: Futures, stocks, and spot currency trading have large potential rewards, but also large potential risk. You must be aware of the risks and be willing to accept them in order to invest in ...
more

