
The Real Cost Of Growth For Gold Miners
In the Real Cost of Mining Gold we examine cost reporting in mining which can be made obscure by conventionally used non–GAAP measures. We standardized and reviewed the financial ratios of seven major mining companies historically and rated them based on cash adequacy and operational health.
In The Real Value of Gold in The Ground we studied 253 gold M&A transactions from the period 1990-2013 and applied Comparable Transactions Method to benchmark the value of an ounce of gold in the ground to be used in our project valuations.
In this series we turn our attention to growth in the gold mining sector, the most active of which, occurs at the Mid-Tier level. Mid-Tier companies emerge and grow as producers employing one or some combination of the following strategies:
- Identify, explore and develop one or several properties all the way through to production
- Acquire one or consolidate several advanced stage properties and develop through to production
- Acquire an existing mine or consolidate several existing mines
Here we study the growth of eight Mid-Tier gold companies: B2Gold (TSX:BTO)(BTG), New Gold (TSX:NGD)(NGD), Endeavour Mining (TSX:EDV)(EXK), Oceana Gold (TSX:OGC)(OCANF), Primero Mining (TSX: P)(PPP), Newmarket Gold (TSX:NMI)(NMKTF) , Teranga Gold (TSX:TGZ)(TGCDF), and Alamos Gold (TSX:AGI)(AGI).
Part 1: MEASURING GROWTH
Growth in gold mining is reflected in:
- Growth in Reserves & Resources (R&R) – leading to higher future revenue and higher share price (higher Return on investment (ROI) for equity holders)
- Growth in Production – leads to higher current revenue and higher share price (higher ROI for equity holders)
- Growth in Share Price = higher ROI for equity holders
- Growth in Market Cap = reflects ROI for equity holders
MEASURING COST OF GROWTH
Dollar spent per oz of gold in the ground ($/oz)*
Our previous research showed that pre-production stage Reserves & Resources (R&R) in the ground are valued at $90/oz R&R or less on the market and R&R in the ground owned by producing major miners are valued historically at around $200/oz..Considering the historic valuations it would follow that to get the bang for their buck, companies should spend less than $200/oz R&R in discovery and development to emerge as a Mid-Tier producers.
Let’s see what the eight studied companies have spent before they started producing:
Dollar spent per oz of gold R&R. To calculate the dollar amount spent to discover and develop one ounce of R&R we go to the companies’ annual financial statements for the respective year when production first commenced.To derive the total capital deployed for the development and/or acquisition of all existing R&R we sum Share Capital (the dollar value of all issued equity) and Net Debt (Total Liabilities – Total Current Assets). To obtain the cost per oz then we divide that sum to the total number of R&R that company has in the ground –
Dollar spent per oz of R&R = (Share Capital + Net Debt)/R&R
Costs Incurred Prior to Production ($/oz)
|
Company |
Total Cost (US$ Mi) |
$/oz |
Year of 1st mine |
Notes |
|
Primero |
482 |
169 |
2010 |
Acquired a producing mine for cash and shares in conjunction with IPO |
|
NewGold |
222 |
163 |
2008 |
Merger of 3 companies - 2 producing |
|
Endeavour |
656 |
125 |
2011 |
Consolidation of investments into a mining company |
|
Teranga |
342 |
113 |
2010 |
Acquired producing mine for shares in conjunction with IPO |
|
B2Gold |
258 |
86 |
2009 |
IPO in 2007, acquired advanced exploration projects from Anglo in Columbia |
|
Oceana |
634 |
74 |
2007 |
Acquired a producing mine, consolidated interests in conjunction with IPO |
|
Alamos |
114 |
38 |
2005 |
Optioned advanced project then merged with a partner to develop the mine |
|
NewMarket |
90 |
16 |
2009 |
Acquired advanced stage projects |
|
Average |
350 |
98 |
As expected the dollar cost per ounce for each of the companies is below the $200/oz albeit ranging widely from the lowest of $16/oz to the highest of nearly $170/oz.
Once in production, mining companies have to continuously replenish their Reserves and Recourses to maintain revenue levels over a long run.Developing R&R takes time and money therefore, to sustain long-term operations, mining companies have to continuously develop and/or acquire R&R.In a way they have to continuously grow to maintain their size and then they have to grow even more to scale up.
Organic Growth occurs through exploration and development of the company’s existing mineral properties. As we already showed the cost of organic growth is captured by the balance sheet and can be easily expressed in dollar value per oz of R&R.
Growth through M&A: Very often Mergers and/or Acquisitions do not involve exchange of cash and if they do, it would often be a combination of shares and cash.In scenarios with exchange of shares the dollar value cost measure is not as straightforward. Take the following simple example:
Company A and Company B are both pursuing acquisition of the same existing asset. The acquisition would require the payment of 65 million in an all share transaction.
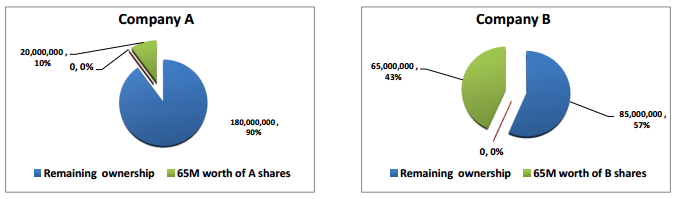
Company A’s
Shares Outstanding: 200,000,000
Current share Price: $3.25
Market Capitalization: 650,000,000
Company B’s
Shares Outstanding: 150,000,000
Current share Price: $1.00
Market Capitalization: 150,000,000
In dollar amount both companies paid the same price. However in terms of shareholder dilution the prices paid are very different; Company A has to give up 10% of its equity ownership while Company B has to give up 43% ownership.
In order to capture the costs each company paid to achieve growth we use Full Shareholder Dilution.This is measure of actual plus potential (in the case of streaming) equity dilution companies undergo to develop and/or acquire the ounces of gold in the ground (R&R). A good way to think about this measure is instead of only asking the question “what cost did the company pay for growth, to ask “what did the company forgo and/or will forgo in the future in order to achieve this growth?” To derive the Full Shareholder Dilution cost we convert all existing debt financings including all present and future streaming obligations into equity at current share price. Once we complete the conversion we can compare what the eight companies have given up in exchange for the growth they accomplished.
Full Shareholder Dilution
To convert all regular debt from the balance sheet into equity we simply convert net debt into number of shares using the current share price.
Streaming agreements are not as straightforward. In a typical metals stream financing, a streaming company makes an upfront payment to a resource company in return for the right to purchase a fixed percentage of future production of one or more metals produced by a project, and makes on-going payments for each unit of metal delivered equal to the lesser of a fixed price and the prevailing market price at the time of delivery. Streaming transactions are generally long term in nature and are often for the life-of-mine.
Taking into account only the upfront payment for the development & production does not reflect the full cost to shareholders. Shareholders will forgo future revenues even after the upfront payment is repaid.
To illustrate, Teranga Gold entered into a streaming agreement with Franco Nevada to acquire and build the OJVG project.In exchange for an upfront payment of US$ 135 million, Franco Nevada will receive 22,500 oz of gold annually for the first 6 years (135,000 oz in total) and after that will be receiving 6% of the annual production for up to 34 years.Currently the OJVG project contains 3.63 Mi oz in Reserves and Resources combined. If the full amount is mined and no further resources discovered, an additional 80,000 oz will be delivered to Franco Nevada.At todays prices (US$ 1,100/oz) this would yield Franco Nevada US$ 186 million (based on current Reserves) or US$ 475 million back (based on current Reserves + Resources) in the latter case costing shareholders US$ 340 million in addition to repaying the upfront payment of US$ 135 million.
Three of the companies in our group have streaming agreements: New Gold and Teranga Gold entered into streams in 2013 while Primero purchased both of its mines with streams already attached.
In our calculation of Full Equity Dilution for all three companies we have included the upfront payment as well as the present value of lost future cash flows to stream (long term Au price used is US$ 1,100/oz).
Full Shareholder Dilution = Total Shares Outstanding + Net Debt Fully Converted into Shares + Present Value of Future Streaming/Royalty Obligations Fully Converted into Shares
The following table compares percentage growth in Reserves & Resources and percentage growth in gold production for each company relative to the percentage growth in Full Shareholder Dilution since the time each one commenced production:
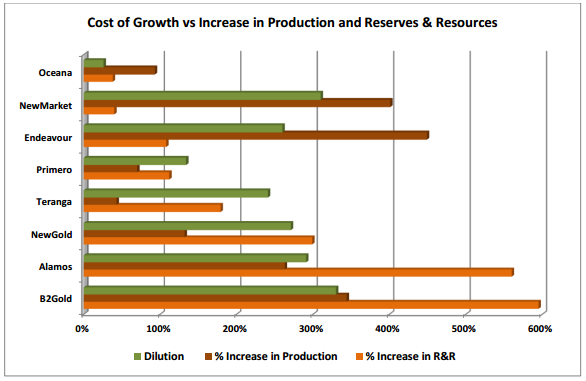
That table shows that:
- Oceana has the lowest dilution since it commenced production. Production has nearly doubled and given the lack of increase in R&R it is most likely a result of the developing of pre-existing R&R. The marginal increase in R&R is due to a higher price of gold used for the calculation.
- New Market’s production increase comes at a high dilution price (all in the early years of operations).The R&R growth is again attributable to increases in gold price used to calculate them.The company used the money to increase production from pre-existing R&R.
- Endeavour’s increase in production is was also highly dilutive for shareholders; there is no significant increasing R&R.
- Primero’s and Teranga’s levels of dilution seem disproportionately high compared to the increase in R&R and production levels.In the case of Primero, the growth and dilution were a result of one acquisition. Similarly, Teranga’s increase in R&R is the result of one acquisition.The increases in production were attained in the early years as the producing mine was fully developed. It appears that both companies paid a high price for what they purchased.
- Newgold’s percentage increase in dilution was nearly the same as their increase in R&R and twice that of production. Newgold’s growth however was a product of mergers among equals rather than capturing upside potential.
- Alamos and B2Gold have created the most value to their shareholders.Both increased R&R by nearly twice percentage increase in dilution and production by the same percentage as the dilution.
* All currency figures in this paper are in USD
>> Read Part 2: The Real Cost Of Growth For Gold Miners
Disclaimer Cipher Research Ltd. is not a licensed broker, broker dealer, market maker, investment banker, investment advisor, analyst, or underwriter and is not affiliated with any. There is no ...
more

