
The Question Now – Where Next For Gold?
With many traders and investors wondering why gold cratered following the Fed last week, it’s time to step back from the daily timeframe and take a look at the weekly chart which is a little more revealing in terms of what we can expect to see over the next few weeks. So first things first.
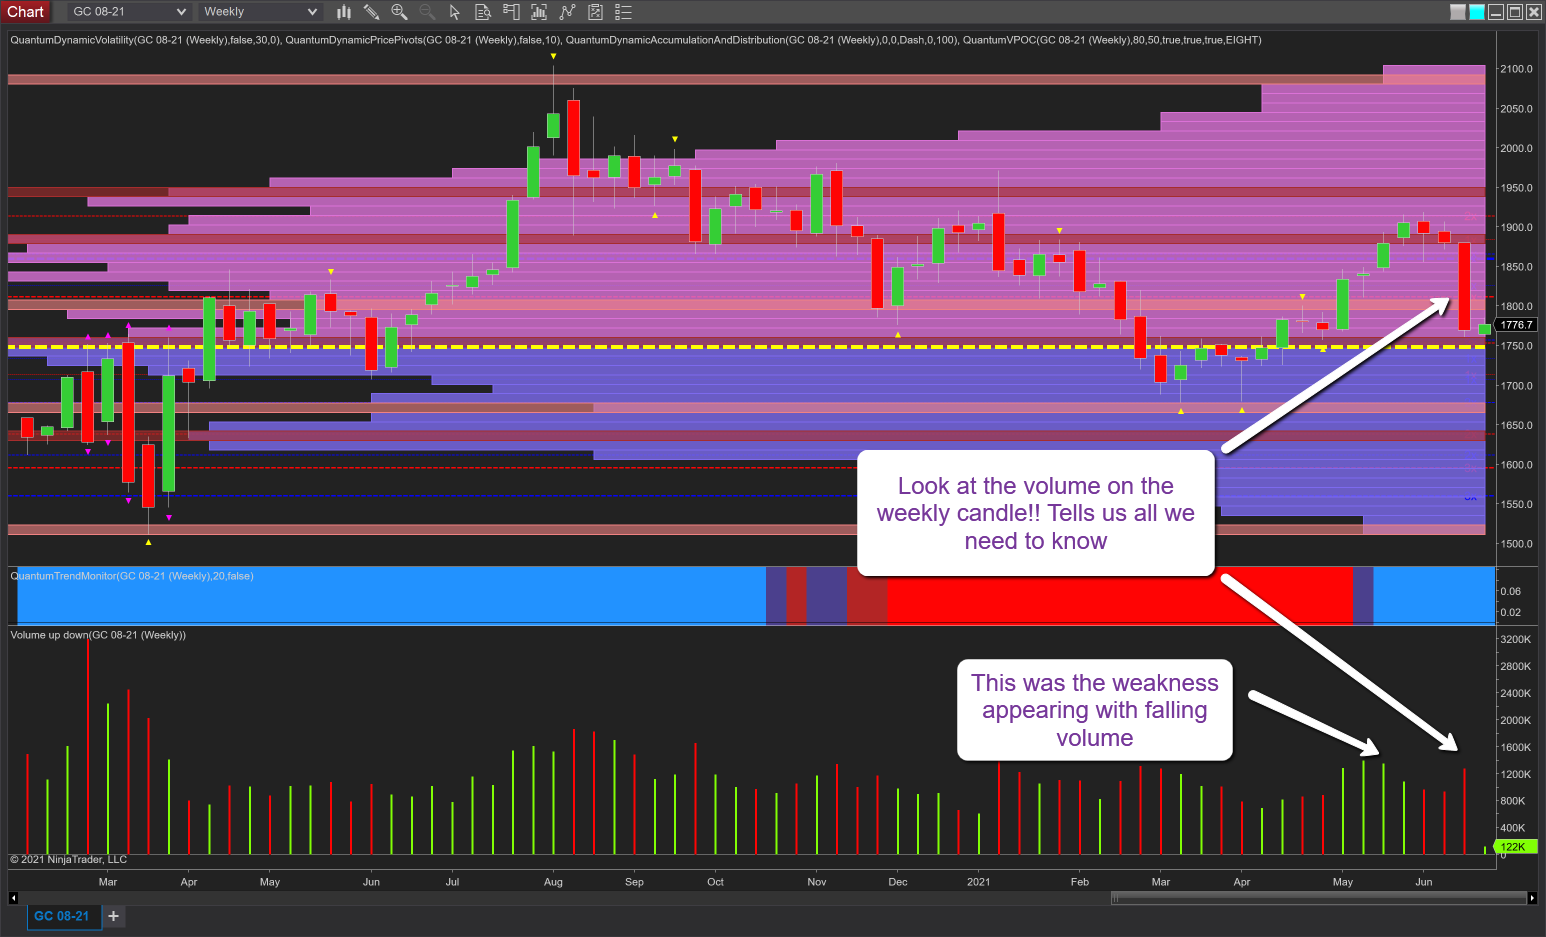
First, let us consider the volume on last week’s wide spread down candle which is clearly anomalous as it is far too low for such a dramatic move and a quick comparison with previous candles confirms this immediately. Benchmarking is one of the key principles of volume price analysis and is the starting point whenever we have such dramatic price action as it is the only way we can try and establish the validity of any such move. What we have here is a marginal increase in volume, but well below what we might expect, so the conclusion is clear. The big operators are not joining this move lower, and hence gold is unlikely to fall further. In other words, this is a shakeout as with many other markets and in the case of gold one which was helped with a surging US dollar. Note also on this timeframe we have descended to test the VPOC which is anchored at $1750 per ounce and which is therefore likely to provide the requisite platform of support in much the same way as it has in the past.
Prior to last week, gold was showing signs of weakness with the rally through May accompanied with falling volume as we approached the $1900 per ounce area, and as I have outlined in many gold posts, and indeed other markets, for a continuation of the bullish trend we need to see this accompanied by rising volume, whatever the timeframe. So what next for gold? And to answer my own question, I expect to see a recovery much the same as we saw in March, April and May. In other words, a congestion period at the VPOC, followed by a series of steps back to test the $1900 per ounce are in the longer term. From there it is volume that will dictate whether it moves any higher. It will need to be strong and rising to drive the precious metal through the mass of resistance that awaits on the VPOC histogram to the right of the chart. That is the key and will be revealed once we arrive at this important level again.
(Click on image to enlarge)
Disclaimer: Futures, stocks, and spot currency trading have large potential rewards, but also large potential risk. You must be aware of the risks and be willing to accept them in order to invest in ...
more

