
The Old Dominion “Snapback” Stock Market? (And Sentiment Results)

The theme of this week’s market commentary is “Snapback.” I picked it:
1. Because I like the Country band – Old Dominion.
2. To explore the question of whether in fact, this is a “Snapback” rally or actually a fake-out.
Unfortunately, the lyrics of the Old Dominion song “Snapback” made no sense to me until I googled the word “Snapback” and found out they were referencing baseball caps that have the “snaps” in the “back” of the hat so that you can adjust it:

As I thought more about it in the context of this market, having flexible thinking and the ability to adjust will come in handy to determine if in fact we do get a market “snapback.”
Listen to Old Dominion – Snapback Here
On Monday of this week – I was on Fox Business explaining how we have generally dealt with periods of dislocation historically and what we are doing last week and this week.
You had a 15.8% peak to trough correction in the S&P 500 in a very short period of time. Usually when you have that level of damage in such a short time frame, it can take some time to heal.
On Friday, I said, “The Stock Market is the only place in the world you can go that when they hold a clearance sale, no one shows up.” You can see what I was referring to here.
So how do we handle situations like this? (this is how we do it, not necessarily how you should)
1. Decide how much cash you want to put to work.
2. Break it up into 5-10 separate units (slugs).
3. On “red” (down) days we are adding high-quality stocks (large-cap businesses with moats) that have overshot (the indices) to the downside (we give a few examples in the video).
4. On “green” (up) days we sit on our hands and do nothing (no chasing). Exceptions are individual stocks we like that might be down on the day (but we prefer to buy on red days generally).
We were able to get 3 “slugs” off on Thursday, Friday and Tuesday. We hope to put some money to work today (if futures are any indication). When you operate like this, rather than fear red (down) days, you are hoping for them because you have more “slugs” of cash to put to work (I referenced this on Fox Business Monday – above).
If the market rallies we don’t chase, but rather are grateful that we were able to put three units of cash to work in high quality stocks that have overshot to the downside.
If we retest (or even break the lows) in coming days/weeks, we are happy because we can put more of the cash to work for the long term.
Maximum flexibility, like an adjustable “snapback” hat…
Federal Reserve:
So what does the “surprise” rate cut mean going forward? A few minutes after the cut (on Tuesday), I was asked to call into Yahoo Finance to give my thoughts. You can listen to the clip here.
Later that night, I went on i24News to elaborate on the “Surprise” cut. I explained how it would filter through the system over the next 4-6 months and support a back half recovery (coupled with other factors).
The key emphasis I laid out was that lower rates could be the catalyst for global coordinated FISCAL stimulus (infrastructure spend) moving forward. Italy committed 3.6B euros this week, while Germany signaled it was open to finally making the leap (to fiscal stimulus).
In last week’s VideoCast, I laid out the case that this was not the time for the Fed to be tapering back on the liquidity facility (and that this exacerbated the correction). I made the case that they should restore the $50B repo window (which had been shaven down to $25B a day) until they actually began to see “discouraged workers” re-entering the workforce [labor force participation rate has room to run to 65%+ (from ~63.5%)].
They opted to go about it through a 50bps emergency cut instead (Shock and Awe)…
Perhaps the Fed will do both depending how the data comes in over the next few weeks…
OPEC+
The magnitude of the OPEC+ meeting March 5-6 is bigger than most people are focused on. Here’s why:
- The energy sector is a heavyweight within the High Yield/Junk Bond indices. When WTI Crude stays below $50/bbl we see credit spreads widen. The longer credit spreads widen, the more you have a contagion risk to the banks and financial system – as default risk increases (or at least the market begins to sniff that out and behaves in a way that implies collateral damage). No one wants to see credit markets tighten.
- Estimated demand destruction from the coronavirus is ~900k/bbl.
- This has largely been offset by Lybia’s production of 1M/bbd being take offline – due to internal strife.
The market had originally priced in 500k/bbd cut several weeks back. I was on Julie Hyman and Adam Shapiro’s show on Yahoo and I suggested that OPEC+ would be inclined to do a “shock and awe” production cut (over and above what the market had priced) in order for the Saudis to diversify their income stream (through floating more of the Aramco stock).
The Saudis only floated ~1% of ARAMCO at the IPO and they need higher prices to continue to lay off stock at their desired $2T valuation target. They will not get that pricing without Brent above $65/bbl (WTI ~$60/bbl). The key question is whether Russia will go along. I do think the developed world will encourage a larger OPEC+ production cut so as to stabilize credit markets/spreads (as central banks are all approaching the zero-bound). We’ll know within 48 hours...
Now onto the shorter term view for the General Market:
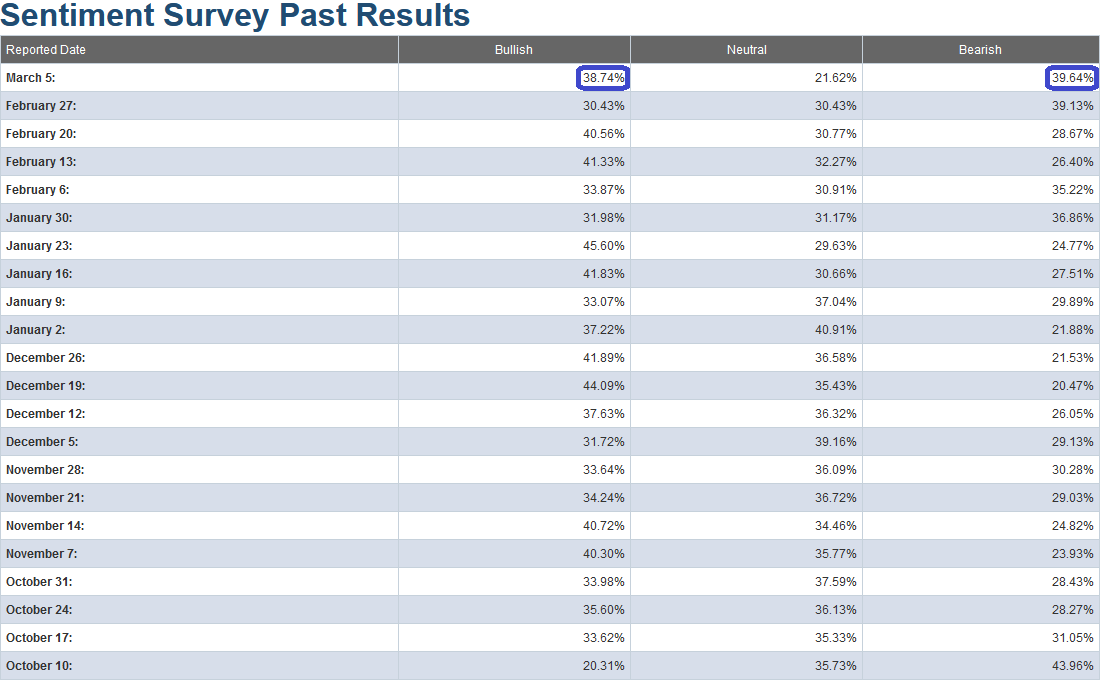
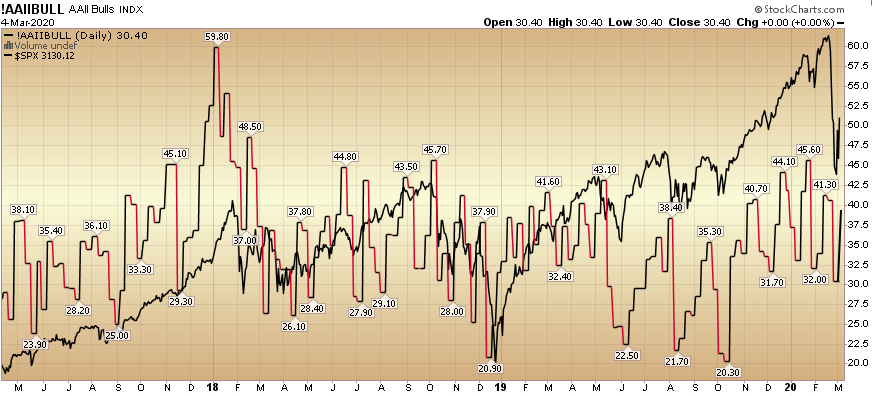
This week’s AAII Sentiment Survey result (Video Explanation) Bullish Percent jumped to 38.74% from 30.43% last week. Bearish Percent ALSO rose to 39.64% from 39.13% last week. Neutrality dropped from 30.42% last week to 21.62% this week. I cannot remember a time when both bullishness and bearishness rose in the same week (or that neutrality dropped so precipitously). It is likely attributable to confusion created by the wide daily swings.
(Click on image to enlarge)
(Click on image to enlarge)
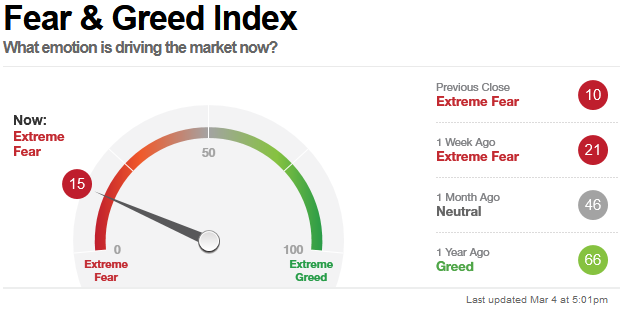
The CNN “Fear and Greed” index dropped from 21 last week to 15 this week. We are nearing/at an extreme in sentiment on this measure. You can learn how this indicator is calculated and how it works here: (Video Explanation)
(Click on image to enlarge)
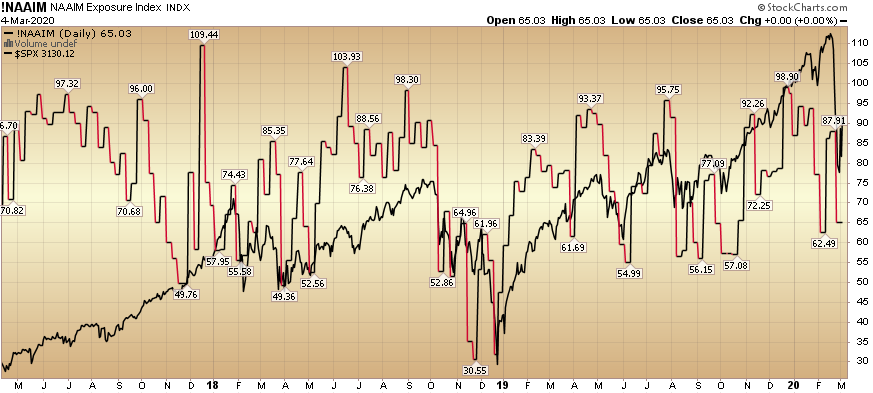
And finally, this week the NAAIM (National Association of Active Investment Managers Index) (Video Explanation Here) collapsed from 87.91% equity exposure last week, to 65.03% this week. They chased up at exactly the wrong time, and if the rebound continues in coming months they will have to chase (yet again) as they are now underweight:
(Click on image to enlarge)
Our message for this week is similar to last week:
We are selectively adding to those stocks/sectors which are nearing valuation levels that we would define as “pricing in at/near the worst case scenario.”
Most stocks do not yet meet this measure (as the “worst case” is unlikely to materialize), but for those that do we are adding and will continue to do so as opportunity presents itself in coming days and weeks.
As for those who have a long term horizon, this is mostly noise. It is more likely than not, the market will make new highs before year-end (2H) as Boeing gets the 737 Max back online and its earnings give a turbo-boost to the S&P 500 (they have lost $16/share of earnings power in the last 60 days due to the 737 Max).
But for now, it’s day by day and opportunistic execution…
Disclaimer: Not investment advice. For educational purposes only: Learn more at HedgeFundTips.com.


