
The Meaning Behind Gold's Triple Top
In a previous article I wrote:
"Looking at this chart, it should be apparent that gold at $2000 is fully-priced. Unless you are convinced that the US dollar is going to crash soon, then expectations for much higher gold prices at this point are unwarranted." ($10,000 Gold Or A Triple Top?)
The article was published in August 2020 and the chart is reprinted below...
Gold Prices - 100 Year Historical Chart (inflation-adjusted)
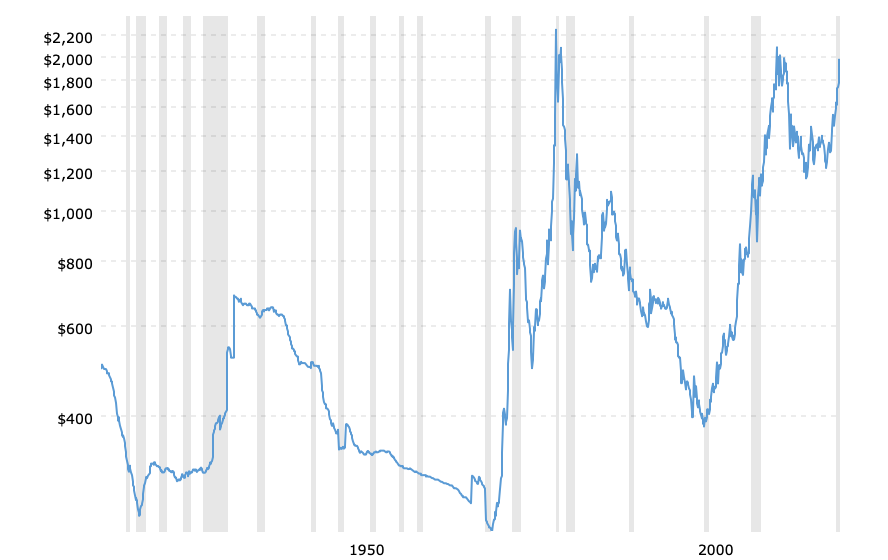
Last August, the expectations for much higher gold prices were fueled by unreasonable expectations fostered by various items and events such as Fed money creation, interest rates, recession, a weak economy, civil unrest, a contentious national election, etc.
None of these things have any bearing on gold's price (see Gold's Singular Role). Nevertheless, investors and analysts continue to point to them as justification for their expectations about the price of gold.
After posting an all-time high price of $2058 in August 2020, gold established two successive recent lows at about $1775 in December 2020 and $1675 this past March. Some of the fervor dissipated, but the past couple of months has seen a recurrence of gold fever.
Below is the same chart as above, but updated to include activity for the past nine months...
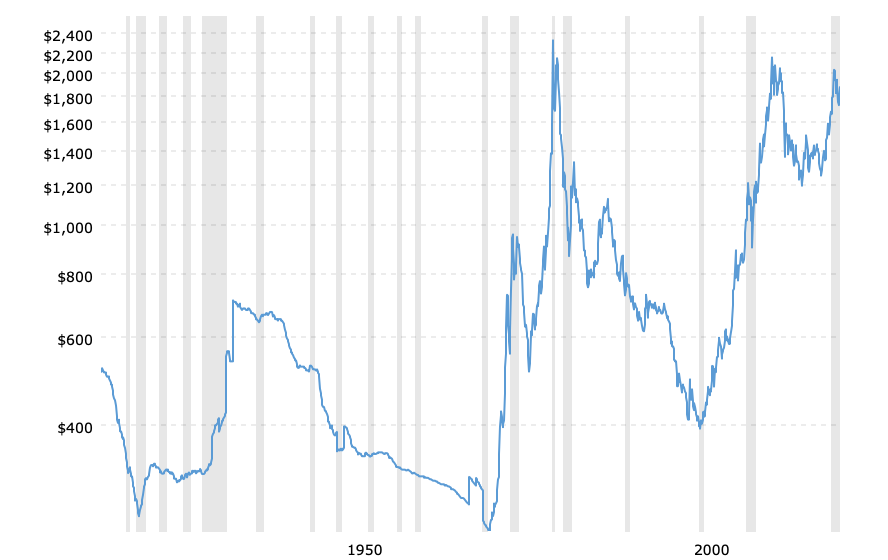
In the charts, you can see that there are three distinct periods of rising gold prices. The first two periods were each a decade in length: 1970-80 and 2000-2011. And both of those periods were preceded by longer periods of time - forty years and twenty years - during which gold's price was not increasing.
The third period was shorter in length and lasted five years from January 2016 to August 2020. It was preceded by a decade of declining gold prices.
The second chart confirms that the triple top is still intact. The price at which gold peaked last August is just shy of Its peak in 2011; and before that, in 1980.
So why did gold stop at those particular price points and what are the implications for those expecting higher gold prices now and in the future?
THREE PEAKS FOR GOLD
The stopping points in the chart are the points where equilibrium was reached regarding a gold price which reflects the dollar's cumulative loss in purchasing power up to that point.
Peak No. 1 The average monthly price for gold in February 1980 (the month after its intraday peak of $848) was $664 and is shown on the charts. That price represents an approximate 97 percent cumulative loss in US dollar purchasing power that had taken place by that time.
Peak No. 2 Forty-one years later, in August 2011, the average monthly price peaked at $1825 (intraday high of $1895) and is indicative of a cumulative loss in US dollar purchasing power closer to 99 percent.
Peak No. 3 When gold's average monthly price hit a new peak of $1971 in July 2020, followed by an intraday high of $2058 the next month, its price reflected a full 99 percent cumulative loss in US dollar purchasing power since the Federal Reserve began 'managing' our money.
The corresponding inflation-adjusted prices for the three peaks are $2248 oz. in 1980; $2151 in 2011; and $2032 oz. in 2020.
IMPLICATIONS AND WHAT YOU NEED TO KNOW
The successive inflation-adjusted peaks in 2011 and 2020 were slightly short of the 1980 peak. Further rises in gold's price on an inflation-adjusted basis can be expected to stop at the same approximate points.
That is because gold's value is constant and unchanging. One ounce of gold today has the same value that it did in 2011 or 1980 or 1920; and the value of one ounce of gold in the future won't be any different, either.
Gold's price, on the other hand, can continue to rise over time as the US dollar continues to decline. However, the price of gold does not tell us anything about gold. It only tells us what has happened to the US dollar.
Increases in the price of gold come "after the fact". Gold's price action is not anticipatory of future conditions, events.
Gold's higher price over time reflects the actual loss in purchasing power of the US dollar. The point of origin is fixed convertibility at $20.67 oz. when paper dollars could be exchanged for gold at that fixed price.
Since the only reason for a higher gold price is a further decline in the US dollar, then the price of gold cannot be expected to rise further to any meaningful degree until after the dollar has lost additional purchasing power.
As of this point in time, any price for gold close to $2000 represents a ninety-nine percent loss in purchasing power of the US dollar. That brings us back to our opening statement that gold is fully priced at $2000 oz.
(Also see Gold Will Not Surpass It's 1980 Peak)
Kelsey Williams is the author of two books: INFLATION, WHAT IT IS, WHAT IT ISN'T, AND WHO'S RESPONSIBLE FOR IT and more


