
The First Crack In The Golden Dam
It seems that the big downswing I’ve been forecasting has just begun. Gold declined on Jun. 3, and there is no strong reason for it to go back.
Yesterday’s (Jun. 3) daily slide came as a surprise that seems temporary… to most investors. But you know that it’s just the first crack in the golden dam.
The Downswing Is on the Way
Gold has ridiculously good fundamentals. We have open-ended QEs – money is being pumped into the system at an unprecedented pace, even when stocks are well beyond their all-time highs. The world has been in a pandemic for over a year, and the economies were hit hard. And yet, despite all these positive news, gold – the king of safe havens – did not manage to soar above its 2011 highs and then stay above them. Given how extremely positive the fundamental situation is, gold’s reaction is even more extremely bearish. This market is simply not ready to soar without declining significantly first. Bull markets and bear markets move in stages, and even though this time the final slide was postponed multiple times, it’s clear that gold is not ready to soar to new highs without completing its final stage – the downswing.
The history is rhyming regarding the shapes of the price moves as well. Just as gold moved back and forth, forming three distinctive tops in 2008 and 2011-2012, we saw the same thing now – between the August 2020 top and the recent top, which seems to have been the final breath of the short-term bull.
I’ve been emphasizing this self-similar pattern for many weeks, and it seems that the bullish part thereof is now over. Also, it seems that it ended at the combination of two triangle-vertex-based reversal points.
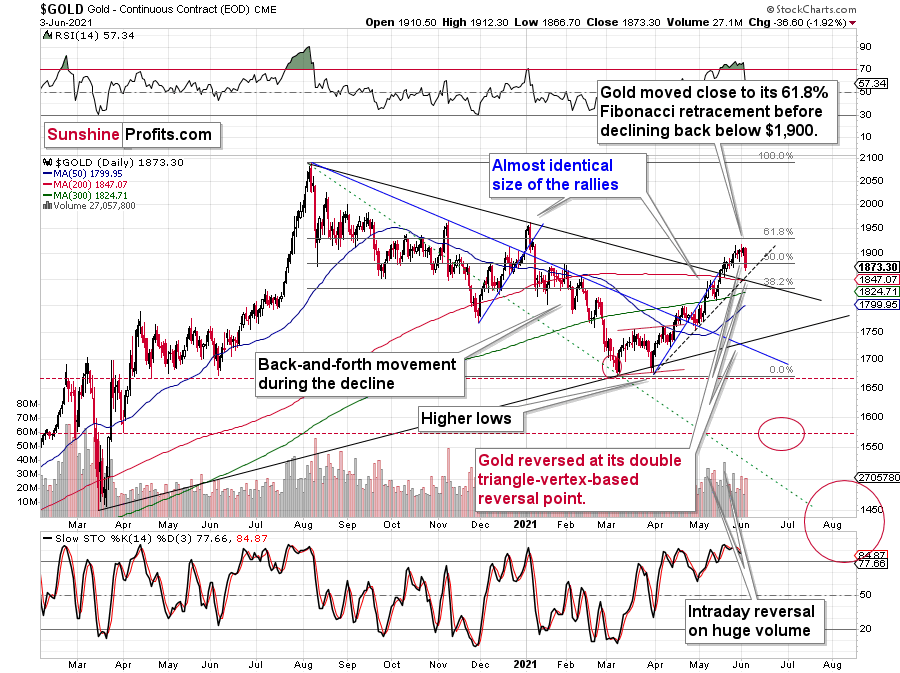
The triangle-vertex-based reversal points have worked multiple times on the precious metals market, and it’s no wonder that we just saw them work once again.
On Wednesday (Jun. 2), gold closed ~$5 higher, and this move took place on relatively low volume. In fact, gold hasn’t rallied on volume this low since Apr. 26. This was a bearish sign for the short term, and indeed after the Apr. 26 session, gold moved lower in the following days.
And, right on cue, gold declined by $36.60 in yesterday’s trading. While this decline might seem surprising to some, it’s actually a perfectly natural thing for gold to do right now.
The low-volume daily rally was only a confirmation, as we knew that Tuesday’s daily reversal was critical all along – based on the triangle-vertex-based reversal we recently saw. Combination of this with highly overbought RSI, a sell signal from the stochastic indicator, and, most importantly, the analogies to how the situation in gold developed in 2008 and 2012, provides us with an extremely bearish price prediction for gold.
The Analogies to the Past
Many other factors are pointing to these similarities, and two of them are the size of the correction relative to the preceding decline and to the previous rally. In 2012 and 2008, gold corrected to approximately the 61.8% Fibonacci retracement level. Gold was very close to this level this year, and since the history tends to rhyme more than it tends to repeat itself to the letter, it seems that the top might already be in.
In both years, 2008 and 2012, there were three tops. Furthermore, the rallies that took gold to the second and third top were similar. In 2008, the rally preceding the third top was bigger than the rally preceding the second top. In 2012, they were more or less equal. I marked those rallies with blue lines in the above chart – the current situation is very much in between the above-mentioned situations. Also, the current rally is bigger than the one that ended in early January 2021 but not significantly so.
Remember what happened when gold previously attempted to break above major long-term highs? It was in 2008 and gold was breaking above its 1980 high. Gold wasn’t ready to truly continue its bull market without plunging first. This downswing was truly epic, especially in the case of silver and mining stocks; and now even gold’s price patterns are like what we saw in 2008.
My previous comments on the analogies to 2008 and 2012 remain up-to-date:

Back in 2008, gold corrected to 61.8% Fibonacci retracement, but it stopped rallying approximately when the USD Index started to rally, and the general stock market accelerated its decline.
Taking into consideration that the general stock market has probably just topped, and the USD Index is about to rally, then gold is likely to slide for the final time in the following weeks/months. Both above-mentioned markets support this bearish scenario and so do the self-similar patterns in terms of gold price itself.
What would change my mind with regard to gold itself? Perhaps if it broke above its January 2021 highs and confirmed this breakout. This would be an important technical indication on its own, but it would also be something very different from what happened in 2008 and 2012. If that happened along with strength in mining stocks, it would be very bullish. Still, if the above happened, and miners didn’t react at all or they declined, it would not be bullish despite the gains in the gold price itself.
The March 2021 low formed well below the previous low, but as far as other things are concerned, the current situation is similar to what happened in 2012.
The relatively broad bottom with higher lows is what preceded both final short-term rallies – the current one, and the 2012 one. Their shape as well as the shape of the decline that preceded these broad bottoms is very similar. In both cases, the preceding decline had some back-and-forth trading in its middle, and the final rally picked up pace after breaking above the initial short-term high.
Interestingly, the 2012 rally ended on huge volume, which is exactly what we saw also on May 19 this year. Consequently, forecasting much higher silver or gold prices here doesn’t seem to be justified based on the historical analogies.
The thing I would like to emphasize here is that gold didn’t form the final top at the huge-volume reversal on Sep. 13, 2012. It moved back and forth for a while and moved a bit above that high-volume top, and only then the final top took place (in early October 2012).
The same happened in September and in October 2008. Gold reversed on huge volume in mid-September, and it was approximately the end of the rally. The final top, however, formed after some back-and-forth trading and a move slightly above the previous high.
Consequently, the fact that gold moved a bit above its own high-volume reversal (May 19, 2021) is not an invalidation of the analogy, but rather its continuation.
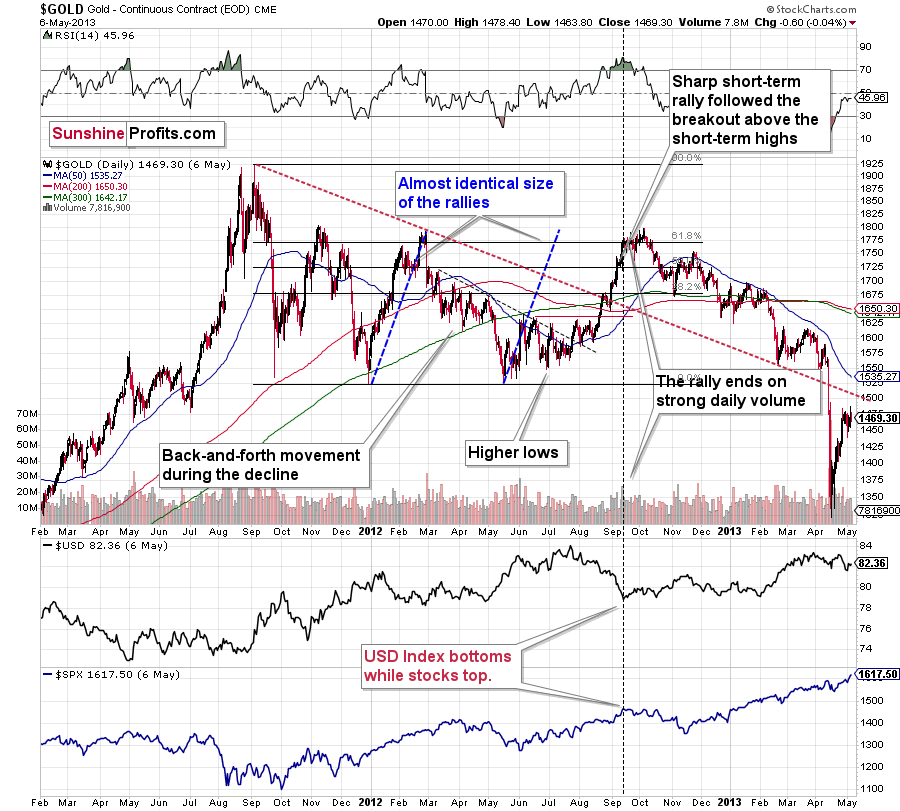
There’s one more thing I would like to add, and it’s that back in 2012, gold corrected to approximately the 61.8% Fibonacci retracement level – furthermore, the same happened in 2008 as you can see in the below chart. Consequently, the fact that gold moved above its 50% Fibonacci retracement doesn’t break the analogy either. And even if gold moves to $1,940 or so, it will not break it. It’s not likely that it is going to move that high, as in both cases –in 2008 and 2012 – gold moved only somewhat above its high-volume reversal before forming the final top. So, as this year’s huge-volume reversal took place close to the 50% retracement and not the 61.8% retracement, it seems that we’ll likely see a temporary move above it, which will create the final top. And that’s exactly what we see happening so far this week.
The lower part of the above chart shows how the USD Index and the general stock market performed when gold ended its late-2012 rally and was starting its epic decline. In short, that was when the USD Index bottomed, and when the general stock market topped.
Also, please note that while it might seem bullish that gold managed to rally above its declining black resistance line recently (the one based on the 2020 top and the 2021 top), please note that the same happened in 2012 – I marked the analogous line with red. The breakout didn’t prevent gold from sliding. When the price reached the line, we saw a short-term bounce, but nothing more than that – the gold price fell through it in the following weeks.
Oh, and by the way, the Fed wants to convince the market that inflation is just transitory in order to prevent the 10-year yield from rising. Let’s ask ourselves now what the Fed would appreciate with respect to gold prices. Exactly, it would be awfully convenient for the price of gold to decline in order to prove the point of the transitory nature of inflation.
Inflation? What inflation? Even gold prices are declining…
Now, as you know, I’m not a fan of all the conspiracy theories that are out there, and I’m not the first to shout gold manipulation or silver manipulation every time the yellow or while metal goes down, but I also know that being realistic is one of my strengths. With the situation being what it is, and since the communities of top investment bankers and the community of officials interlace, I think that we have yet another reason to expect that the gold price is going to slide in the following weeks/months.
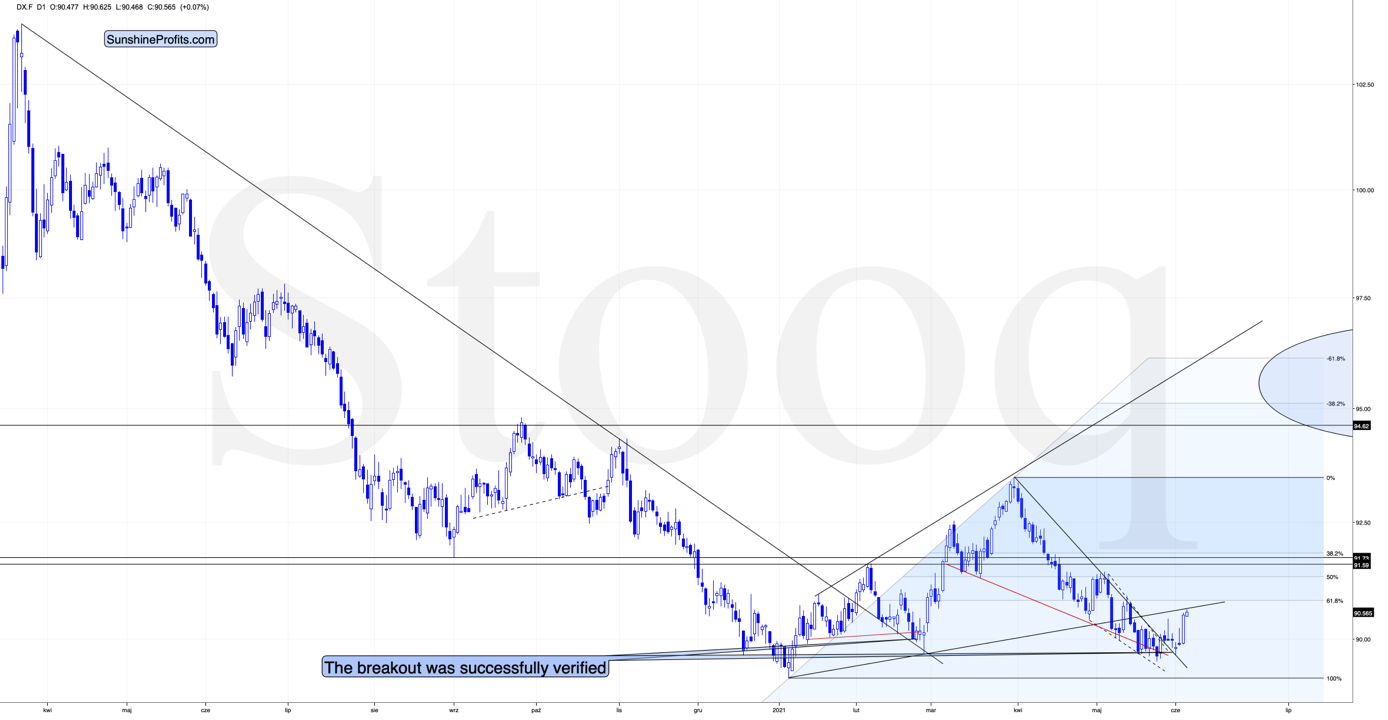
Meanwhile, the USD Index soared right after confirming its short-term breakout, suggesting that the analogy to 2016 and the similarity to how it bottomed (triple bottom with lower lows) in mid-2020 remains intact. And so does the bullish outlook for the universally-hated-and-massively-shorted U.S. currency.
The USD Index paused at the rising resistance line based on the previous lows, and once it rallies back above it, it will be clear to many traders that the trend has already reversed. It will even be clearer when the rally gains more strength and when the precious metals decline even profoundly than yesterday.
Silver and Gold Miners
Having said that, let’s take a look at other markets.
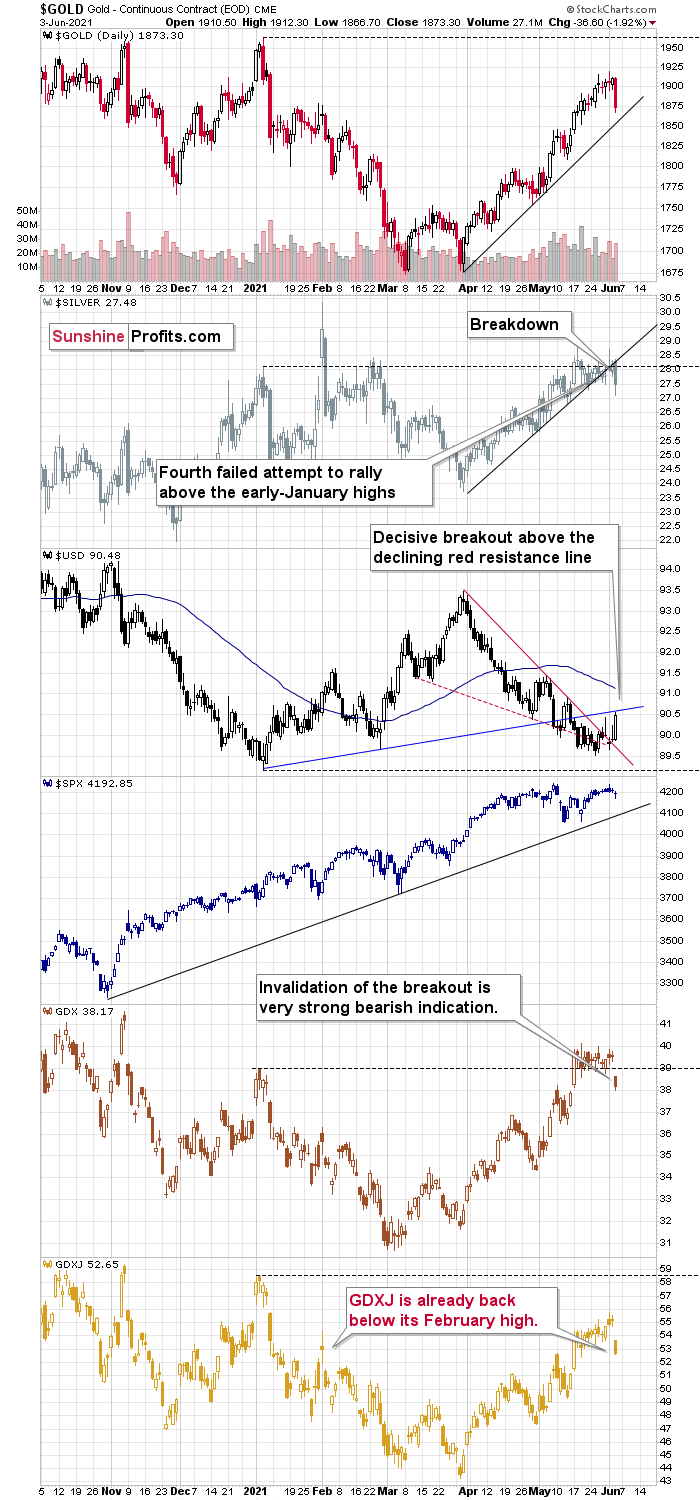
The three notable events that we can see on the above chart are:
- Silver has just broken below its rising support line right after it failed to break above its early-January highs for the fourth time. And this decline happened right after the intraday reversal when silver had outperformed gold. This is exactly how big silver declines tend to start.
- The GDX ETF – a proxy for senior miners – has just invalidated its breakout above its January highs. Invalidations of breakouts are strong bearish signals in general, and this one is crystal-clear.
- The GDXJ ETF – a proxy for junior miners – has never reached its January highs, but it has just invalidated a breakout above its February high. It has also declined more (4.58%) than the GDX (3.46%). The juniors are declining more than the seniors – in tune with my previous analyses.
Overall, it seems that the big downswing has just begun.
Disclaimer: All essays, research and information found on the Website represent the analyses and opinions of Mr. Radomski and Sunshine Profits' associates only. As such, it may prove wrong ...
more

