
The Daily Chart For Copper Delivers A Nice Example Of Wyckoff’s Third Law In Action
Like oil, copper is another commodity that continues to remain waterlogged in a relatively tight range, building support and resistance levels around the VPOC at $4.28 lbs and also sandwiched between support and resistance levels of the accumulation and distribution indicator. Like oil, the price of copper has breached resistance as it attempts to break away and develop some bullish momentum.
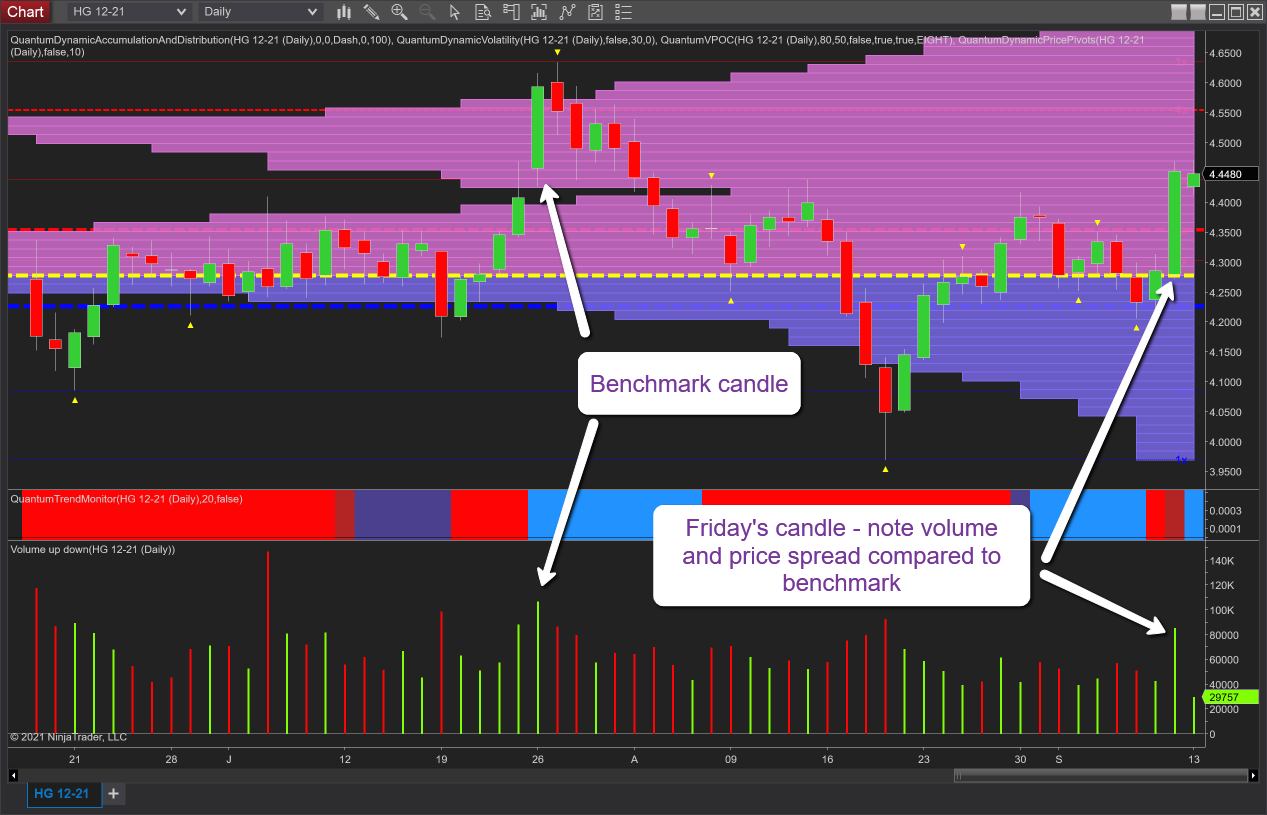
However, let us consider Friday’s candle in more detail. As we can see the spread is wide which is fine but look at the associated volume which looks to be below what we should expect as a result of such a dramatic move. After all, if we consider a possible benchmark candle such as that of the 26th of July, note the volume and price action. The price spread on the day was lower, yet the volume was higher. In other words, if the volume on that day was what was required to propel the price this far, why is the volume lower on Friday, yet the price has moved further? The simple conclusion we can therefore draw is that volume and price are NOT in agreement. In other words, Wyckoff’s third law of effort and result have not been fulfilled and as such we can expect to see the price weaken as this is not a genuine move, but one designed by the big operators to trap traders into weak positions, thinking the price is set to break higher. A nice example of volume price analysis in action.
(Click on image to enlarge)
Disclaimer: Futures, stocks, and spot currency trading have large potential rewards, but also large potential risk. You must be aware of the risks and be willing to accept them in order to invest in ...
more

