
The Course Of The US-China Trade War, Viewed Through The Lens Of Soybeans
Or, hope died in August 2018…
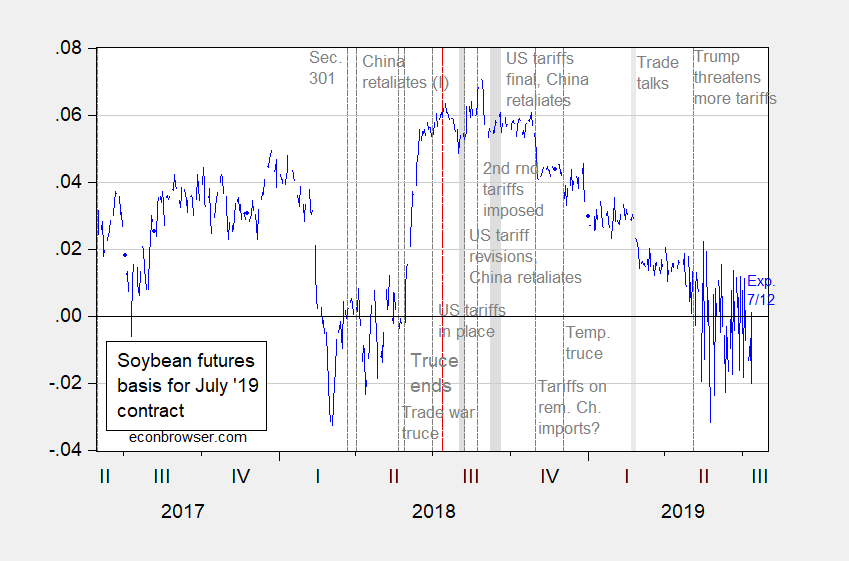
Figure 1: (Log) July 2019 soybean futures contract price minus spot price (blue). Source: ino.com and macrotrends.com, and author’s calculations. Red dashed line at 7/12/2018, one year before expiration of July 2019 futures contract. Dates from Dezan Shira and Assoc.
Typically, the futures and spot should differ by cost of carry, but for soybean futures at the 3, 6 and 12 months horizons, the futures are an unbiased predictor of future spot rates (see Chinn and Coibion, 2014). Hence, the spread can (roughly) be interpreted as an estimate spot rate rising in the future, which is inversely proportional to the probability of a resolution of the US-China trade war (cost of carry is going to vary over the year, so the spread is only partly indicative).
For the course of the spot and July 2019 futures, see this post.
Disclosure: None.


