
The Coming Global Liquidity Crisis…The Kick Off Of The Post Bubble Contraction
We have seen how the PBC has now begun and is making itself felt around the world starting at the periphery of the global economy, next moving to the senior markets of the world and eventually being transmitted to the core of the financial system. As of now, the US markets do not reflect any impact of the PBC, however, there are signs it is fast approaching.
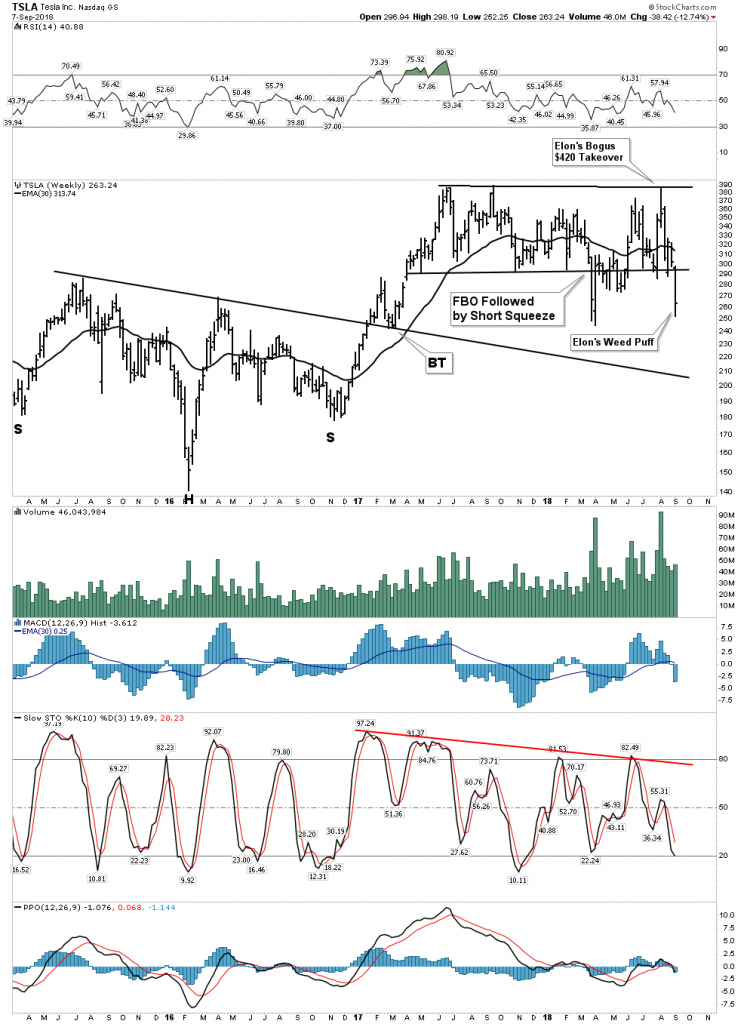
Tesla- Canary in the coal mine
So far US markets don’t seem to care what is happening in other markets around the world. US Markets seem impervious. A few months ago I pointed out that as long as Tesla stays elevated the US market should remain fine. Call Tesla the canary in the coal mine. Tesla continues to operate for one reason only- easy money. Remove the liquidly spigot and Tesla ceases to exist. This company is so obviously a fraud on stockholders, yet it whistles past the graveyard with each outrageous act of its “nut job” CEO. Simply put, as long as stockholders suspend reality in Tesla they are willing to believe anything.
Well, seems the end of this game is now upon us. Looks like Tesla has now finished the process of knocking the religious believers out of their trance. What the professional shorts have seen for a while now (Chanos, Einhorn etc.) is now finally being acknowledged by the masses. I regard this process as a derivative of the mass psychology of the market in general. Once Tesla goes the market, in general, can’t be far behind.
The Toxic USD Phase of the PBC
This is what comes next in the PBC. As money rushes towards safety and global debts are serviced in US dollars the US dollar strengthens. This is the end game of a multi-year slow-motion process we have seen playing out. The below chart shows the flaw of the gold bug narrative. As the US ramped up its money printing through QE the US dollar actually began to strengthen which is the opposite of what gold investors thought would happen:
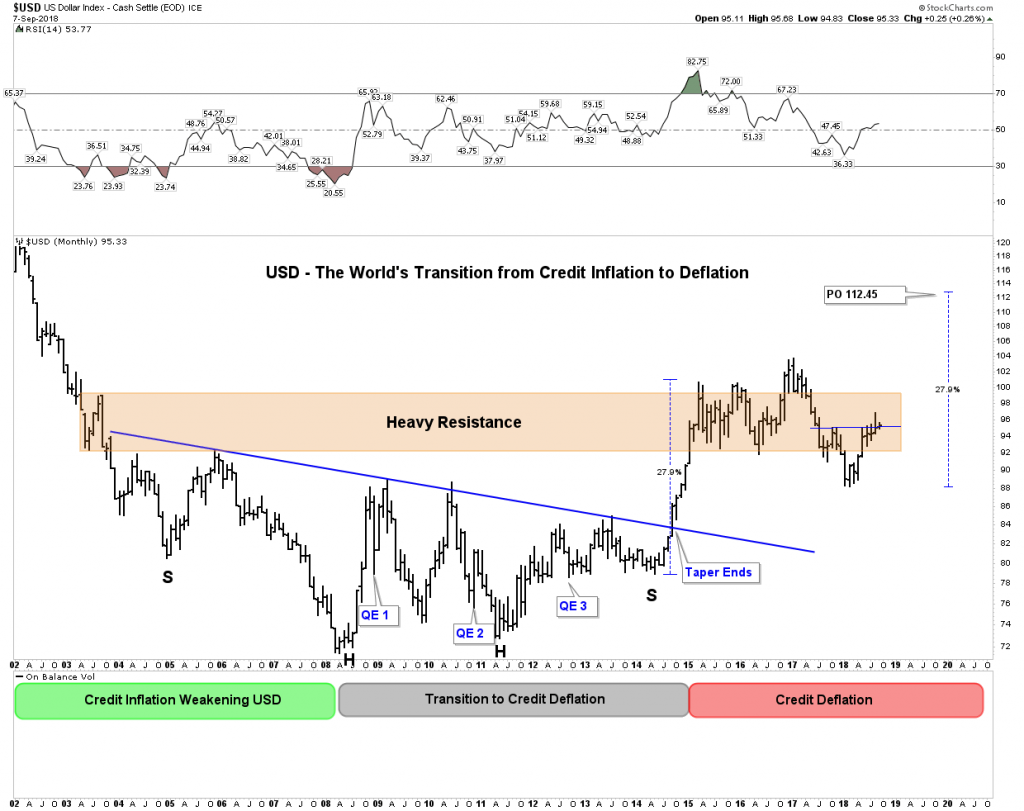
The toxic phase of the US dollar rally starts when the current rally resumes and the USD breaks out of the heavy resistance zone. That’s when things start to blow up and the GLC intensifies.
Gold Silver Ratio– Signaling the crisis is fast approaching
The gold-silver ratio depicts the spread between the two metals. It can be referred to as the metallic credit spread. Like interest rate spreads, it is a leading indicator of stress in the financial system. This is because gold acts as a monetary metal while silver acts primarily as an industrial metal. As industrial activity decreases silver usage declines. Simultaneously as stress in the system increases gold’s monetary usage also becomes more important. In the past, the GSR has reached levels of 80-100 in a crisis. I have stated for years that in the next crisis these levels have the chance of being vastly surpassed perhaps blowing well past 100.
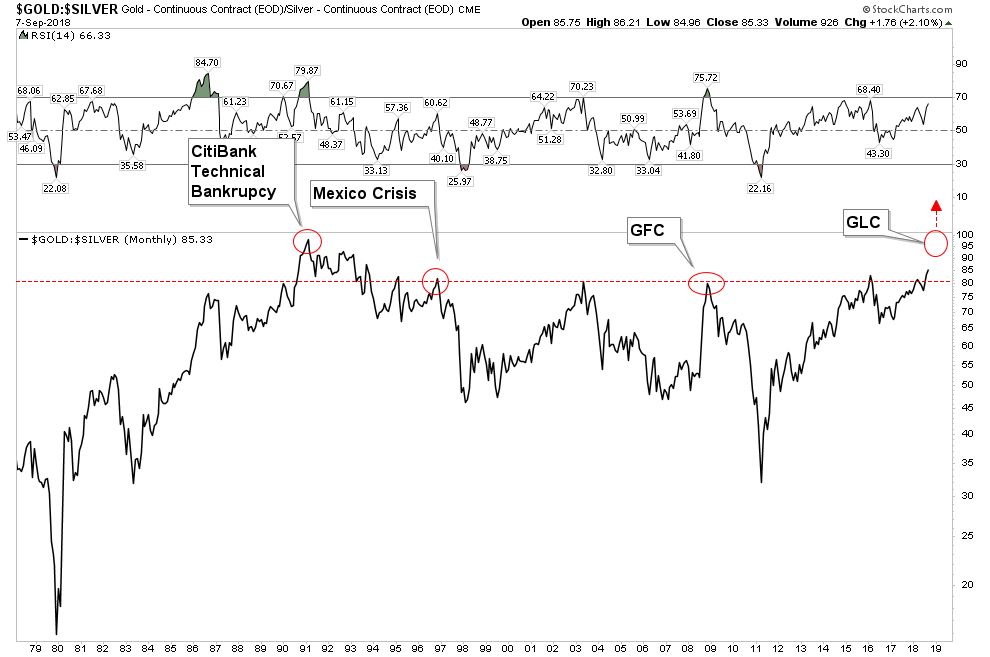
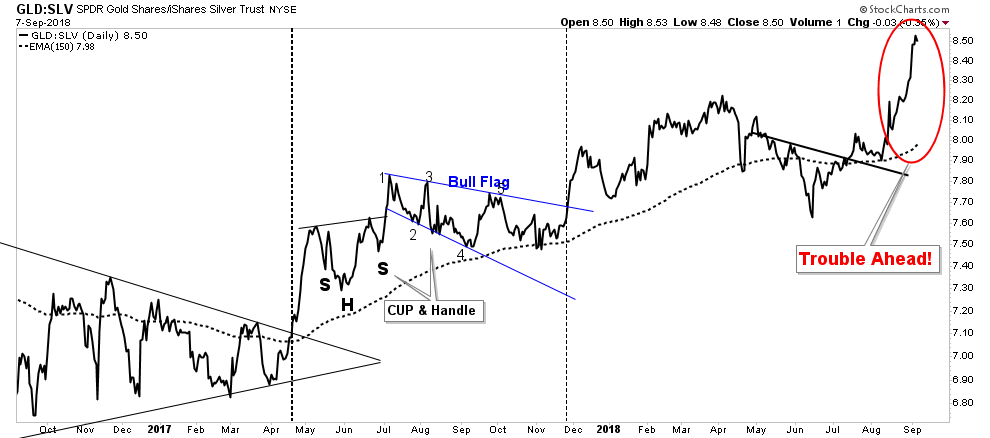
Here is a close-up of today’s GSR signaling trouble ahead in the form of a liquidity squeeze:
What I believe this is signaling is a liquidity crisis beginning at the periphery of the world’s economy. Emerging market debts will not be paid therefore the reconciliation will be made in the currencies. We see this occurring in Turkey right now.
Eventually this dynamic will show up in the senior reserve currency the USD. Worldwide currencies will be devalued against real wealth. What is real wealth? Houses, land, gold, oil, copper, this is real wealth. Ultimately their price will shoot up as currencies become devalued as debts get reconciled. But before this happens the illiquidity crisis will have to run its course and holders of these assets will likely get crushed because they will be thrown upon the pile to be sold in a search for liquidity.
Oil in the GLC
Crude Oil is, of course, the king of commodities and is typically the last to peak in an up cycle. This occurred in 2008 when oil peaked at $147 in July 2008. The stock market had peaked in October 2007 and the crisis was well underway when oil finally put in its top. The same sequence appears to be playing out in the GLC. Oil now appears to have put in a cyclical top. The rally in oil over the past 2 years was simply a cyclical bull within the context of a secular bear just like all of the other commodities.
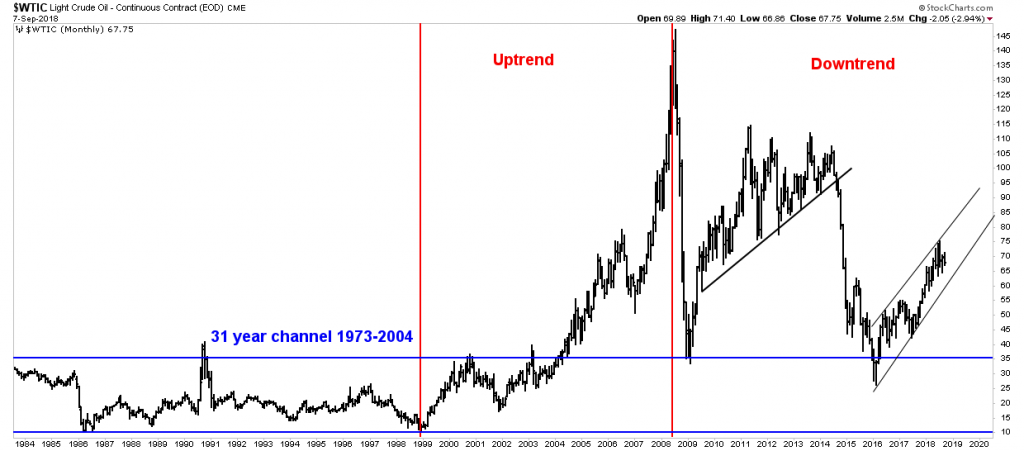
Oil is not going away as some hope it will. Just about everything is made from oil such as plastics etc. It will remain an irreplaceable transport fuel for the foreseeable future and its use will become even more value added in the future. So once the upcoming bear market runs its course, oil should begin its next long-term bull market where prices could go to unheard of levels as it becomes more of a value-added product and less of a transport fuel. Real assets such as oil will rise as a reflection of currency reconciliation. This is when deepwater offshore companies such as RIG will come back into its glory days. Natural gas value plays should also perform.
Oil puts in its top
The daily charts can take on a different appearance than the futures charts because futures trade 24 hours a day. So the continuous futures chart can often be more revealing than the daily chart of WTIC. This indeed happened over the past week as oil put in a prairie dog top. Here we see this below:
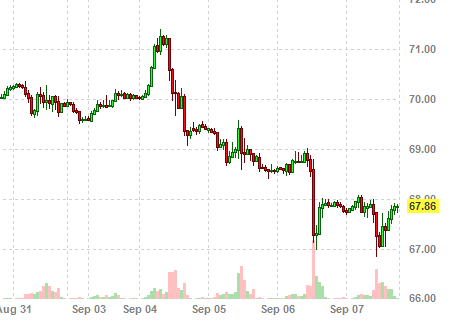
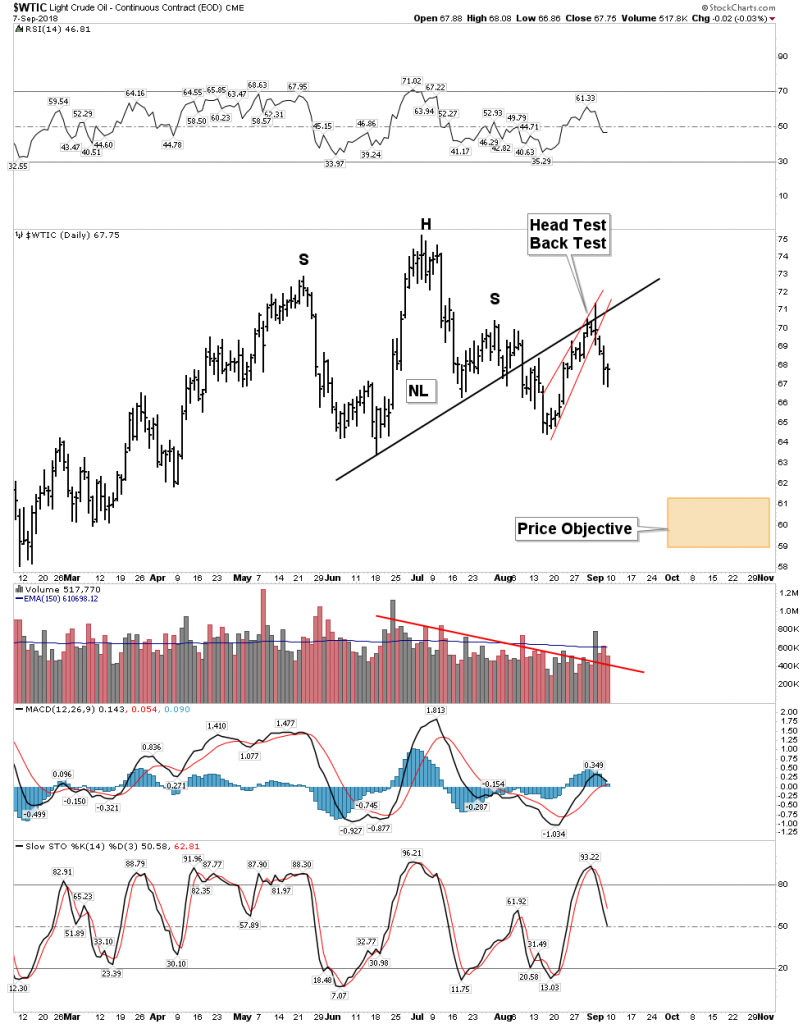
Here we see oil poking its head up like a prairie dog and pulling it right back in during the wee small hours of trading with western markets closed. On a daily chart oil shows a different view, a slanted NL H&S followed by an initial breakdown backtest/head test. It dutifully punished the new shorts (me included) but fell out of its rising wedge. It has now had an initial bounce off of initial support at $67 and now we wait for the decline to resume.
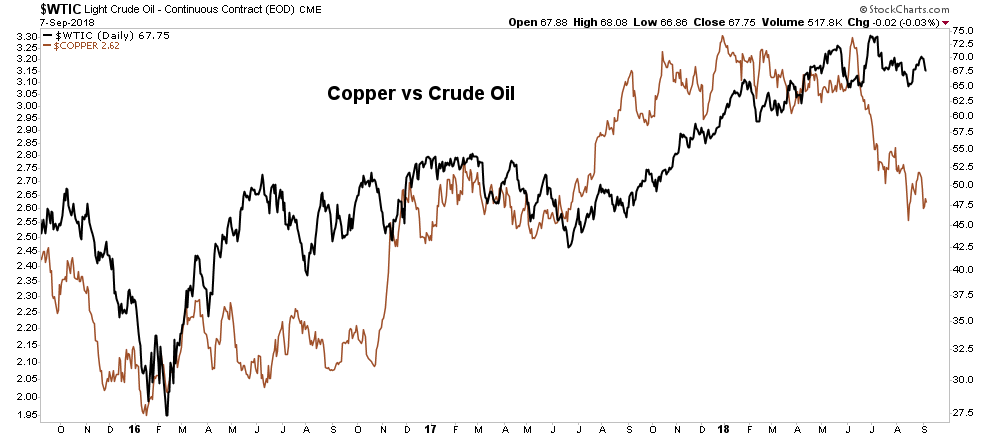
Below we see how oil lags copper in its decline:
Gold- Making sense of it
Is gold and the gold stocks in a bull or a bear market? I believe the answer to this is a bull market that began in Jan 2016. Presently it is undergoing a violent shakeout that feels like a bear market. In the last report, I mentioned that fresh new capital is actually flowing into the sector. This doesn’t occur in a mature bear market. So what explains the downside violent move? I see it as analogous to the previous bull market in gold which lasted from 2001-2011. In that bull market gold and the PM stocks got waylaid in the 2008 GFC, but it wasn’t the end of the bull market, it was just an interruption. In real time, however, it appeared to be the end of the world if you held on to your gold stocks. It seems that’s what is going on now. We are in a bull market but it has gotten interrupted by the early stages of the GLC. Two factors account for the decline in gold. First gold is acting as a liquidity bank to fund other shortfalls, Turkey being an example as it has sold most of its gold as a stop-gap measure. Second, gold underperforms as the senior economy remains in a bull market and the US market remains strong.
Gold’s decline does not appear to be over as is clearly evident through Rambus’ charts, but once the bottom is in, the next phase of the PBC begins.
The Gold Bull Market Resumes its next leg-up
This next phase should begin when the FED ends its QT program. The USD may continue to rise, but the message to the world’s markets will be unmistakable… that the great Keynesian experiment has failed, as they must reinflate the system to prevent a collapse. This is when the gold stocks will begin their advance. Of course being a market they very well may discount this event and start to rise before this.
You have heard this before: Got to be in it to win it!
Golds Smash and Grab
We have all seen the COT numbers and the gold bugs are hanging their hat on them. Gold has to rally since the commercials are now net long. Hasn’t happened in ages, yet gold continues to flounder. What explains it? Tin foil hats on please- gold is undergoing a classic smash and grab. Stated differently there are elements of a bear raid going on here. Don’t think for a moment that other informed big money players don’t see the things I have written about. It is a great opportunity for big money to position itself for the upcoming bull market… a smash and grab.
Copper- The Doctor seems confused
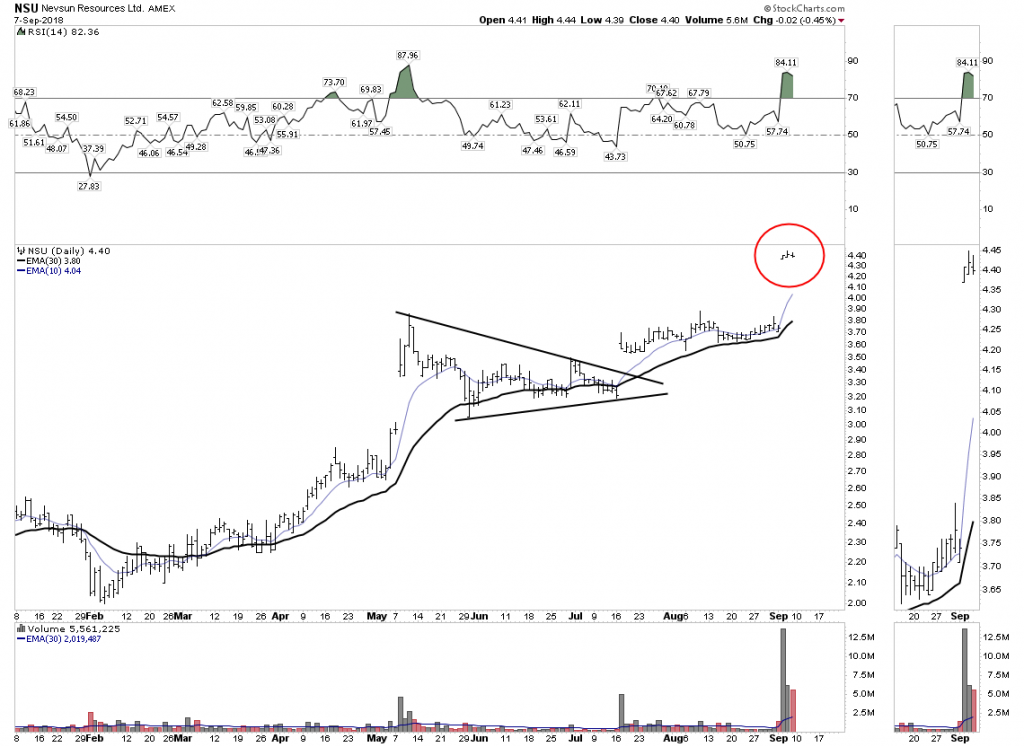
We know that copper sniffs out economic weakness and it has clearly led the decline in worldwide commodities, but I thought the evidence is clear we have a worldwide copper shortage looming on the horizon. Exactly!, but this is the tricky part as it’s true the world will be woefully short the metal in future years once the “green” second electrical revolution gets underway. There is no better sign of this than what happened over the past week with Zijin mining making a massive bid for Nevsun mining. The Chinese being long-range strategic thinkers are attempting to grab this critical asset even though it is clear the Chinese economy is cooling. They see the long-range picture of copper being in strategic short supply in the next decade. Knights, one has to be able to think past the valley directly in front of you!
Nevsun holders, if you held on you, ’re a hero:
Putting together a strategy
Let’s keep it simple and boil this down to a few basic concepts. First off here is a question:
Question: Using valuation data from the past 120 years of recorded market history, What is the projected annual rate of return over the next 10 years from investments entered at today’s current valuation levels?
ANS: 1% per year
But here is the catch, before you can arrive at that 10-year point odds are that you will have to undergo a 40% drawdown!
So why in the world would you hold on to your stocks at this time. You would be far better off selling everything and waiting for a bear market to re-enter on. Then you can look forward to average returns of 10%+ over the next 10 years. Honestly, it’s a no brainer.
So that’s what we are going to do. Go to cash. Now I understand that like me, you probably own some issues that you just don’t want to sell even though you are underwater. That’s ok we will make a few exceptions. But for the most part, it’s time to sell and wait for the bottom to present itself. In the meantime here is what I am doing:
1/3 cash
1/3 US Treasury bonds
1/3 the dogs I can’t sell, but feel will come back.
Everything else has got to go and the second you sell them is the second you will feel free again.
In the mean time, we watch Rambus’ charts and we determine when the bottom gets put in, then we buy… pretty simple and painless actually.
Disclosure: None.


