
The Best Horizons In Time For Investing In Gold
Gold is an extremely singular asset that has demonstrated some utterly remarkable characteristics of late. The measuring of risk, taken on the basis of investment periods, makes it possible to optimize one’s strategy perfectly over time. Gold, unlike most assets, has a risk curve that is particularly stable, and this also tells us something about the cyclical nature of this precious metal. The various investment horizons reveal very different associated risks. It is therefore important to try to capture the true nature of gold here. Indeed, gold stands out from all other assets by virtue of the structure of its evolution, and it is the asset that puts up the most fascinating results.
RISK CURVE DEPENDING ON INVESTMENT HORIZON
Risk is measured temporally (frequency of risk) and in terms of intensity (size of risk). In the first instance, we, therefore, measure the frequency of the falls that take effect in accordance with the time-scale considered (in months). We therefore make calculations independently from the frequency of the correction on the daily, weekly, monthly figures, etc. We then obtain the chart below for the data set for the period 1990-2021. This curve enables us to deduce the investment horizon for which an investor is going to have a risk of loss of varying strength (daily positions, monthly ones, yearly ones, etc.).
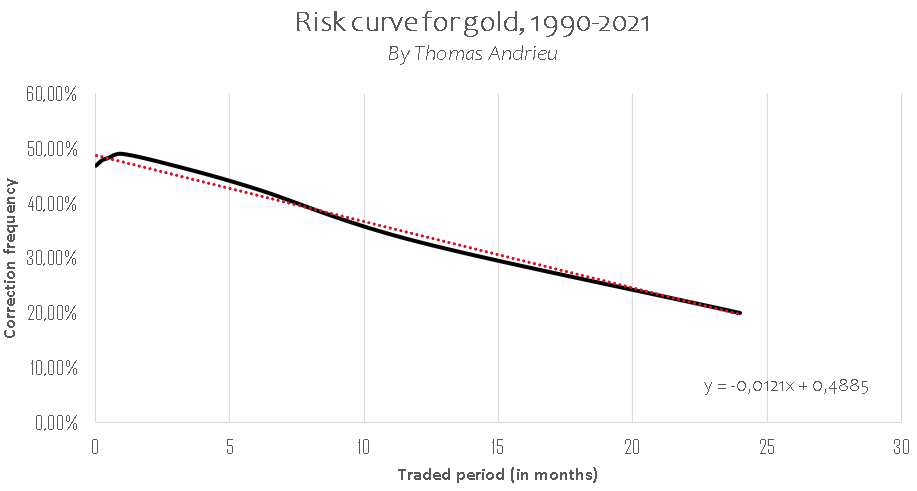
We note, with some surprise, that the frequency of the corrections is very high in the short term and is at its highest at the end of one month. Indeed, the frequency of a daily loss, measured since 1990, is 46.8%, as against a frequency of loss of 47.8% in the weekly period and up to 49% in the monthly period. Thus, if one regularly positions oneself on gold without looking any further ahead than a month, one is exposing oneself to relatively high risk.
The frequency of the falls then starts to diminish, once you reach a time horizon of more than one month. Over 3 months, the frequency of falls drops back to 46.7%, and 42.6% at a horizon of 6 months. The frequency of the corrections thus enables us to stress the fact that gold becomes particularly attractive at the end of an investment horizon of around 6 months minimum.
In the long term, the frequency of corrections weakens more significantly. If one looks at the annual investment prospects, the frequency of the falls is no more than 33%, then 20% over a two-year period. Finally, it will thus be noted that the frequency of corrections falls by an average of 1.2% for each additional month that an investor keeps gold in their portfolio.
Moreover, it will be noted that the law of markets would have it that the curve showing the frequency of risk is more curved than linear (see next section). As we were able to see on the chart, gold follows a descending risk curve, and this makes it a more interesting asset in the very long term. This also shows us the fact that the bullish and bearish cycles are distributed proportionately depending on the time scale, and this is rare.
INTENSITY OF RISK DEPENDING ON THE INVESTMENT PERIOD
The study of the frequency of risk should be put into perspective by looking at the intensity of the risk, depending on the periods considered. The intensity of the variations is measured, in statistical terms, by volatility. Since 1990, gold has had annual average volatility that we can estimate at 13%. That is to say that more than 2 variations in 3 take effect 13% above, or below, the price of the gold at the given moment. If you have an ounce of gold at $1750 with an annual volatility of 13%, this means that the gold will have more than a 2 in 3 chance of ending up between $1522 and $1977 in a year’s time. However, this annualized volatility varies depending on whether we look at the short data (daily, weekly, etc.) or the long data (month, year, etc.).
(Click on image to enlarge)
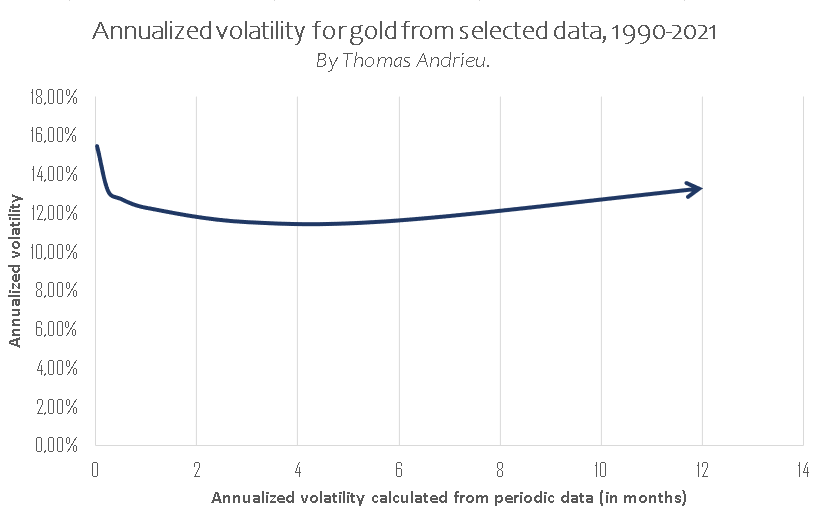
Contrary to most assets, the volatility of gold behaves in a very particular way depending on the time scale. The volatility is higher in the short term on gold, whereas the volatility becomes more stable when one looks at an investment horizon of two to three months. Indeed, it will be noted that the annualized volatility based on the daily data is fairly high, at 15.4%, as against an annualized volatility of almost 11.5% based on the quarterly positions (every 3 months). Put more simply, this means that the daily volatility is almost 34% higher than the quarterly volatility.
With an investment horizon of 3 months or more, the volatility starts to increase again, something that is rare in most assets. This very distinctive behavior, whereby we see a rise in volatility in the long term, should be put into perspective by looking at the reduction in the frequency of corrections over time. In other words, after 3 to 6 months, gold follows cycles that are increasingly bullish, but also increasingly intense. Once an investment horizon of several months has elapsed, the rise in gold’s volatility, therefore, has a more favorable than unfavorable effect on the price of gold. In all cases, gold’s volatility varies relatively little, and gold remains an asset that offers rare stability when it comes to the intensity of the risk.
THE UNIQUENESS OF GOLD
Gold is assuredly a unique asset when it comes to this statistical study. On the one hand, the frequency of the corrections normally follows a logarithmic scale, as is the case for the Dow Jones (see below). For its part, the risk curve for gold is linear, conveying the fact that gold is comparatively less interesting when one takes a period of a few months, but, conversely, far more attractive in the very long term.
(Click on image to enlarge)
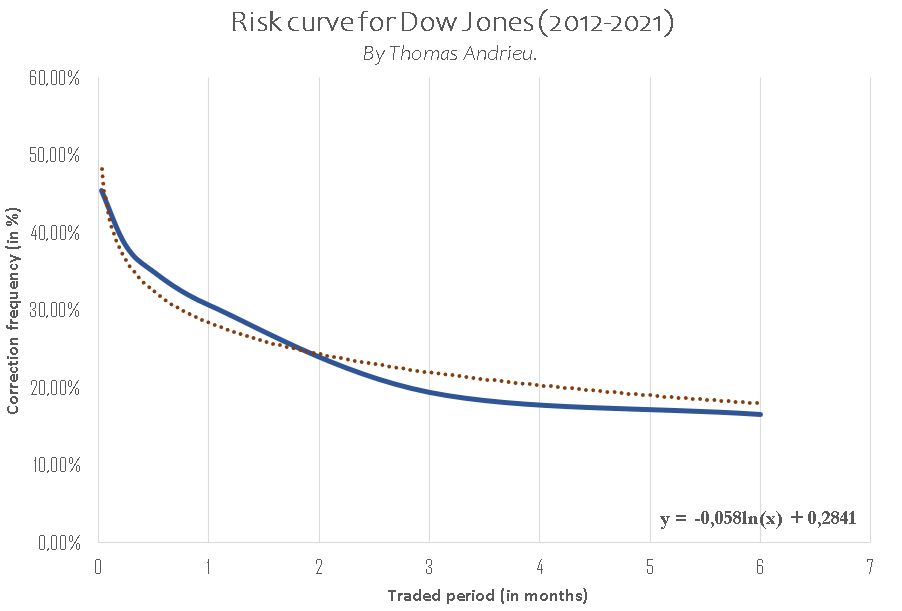
The frequency of corrections on the Dow Jones tends towards 20% at the end of just 6 months, as against almost two years for gold. As such, gold is, automatically, far more attractive in terms of risk than stocks and shares, once one looks beyond a period of about two years. As regards volatility, i.e. the intensity of the risk, gold once again reacts in a way that is very unusual. Overall, the volatility of the Dow Jones follows the curve of frequency of risk depending on the time-scale, and this is consistent and generates trends that are rather dull in the long term. Conversely, for assets like Bitcoin, the volatility increases very substantially in the long term (long-term trends with corrections that are less frequent but extremely intense, thus generating big trend movements). Gold appears to be situated between the two.
Indeed, the volatility of gold is, relatively speaking, very stable, and this holds true for all time scales. Gold does not follow a dull long-term trend, nor does it follow a tumultuous trend. This is a trait that is peculiar to gold. Whereas bullish cycles predominate fairly strongly in the long term, their intensity is equivalent to that observed in the shorter term. This leads to a particularly stable kind of evolution, where the only variation parameter that comes into play is almost the frequency of the cycles depending on the time scale considered.
CONCLUSION
It can definitively be said that the dictum which has it that it is always better to buy physical gold than paper gold appears to be confirmed by this statistical study. Gold remains a calculation for the long term and the very long term. Indeed, the risks of short-term investment in gold are fairly high, particularly over a period of less than 3 to 6 months. In the longer term, however, the risks are reduced more significantly than is the case with most assets, thus making it a very interesting investment. The bullish cycles appear over longer periods, with a recurrence that demonstrates perfect growth and slightly greater intensity. This is the reason why gold, beyond the tumult of speculation or the clamor of stocks and shares, is a truly unique and enticing asset for long investment horizons.
Disclosure: GoldBroker.com, all rights reserved.


