
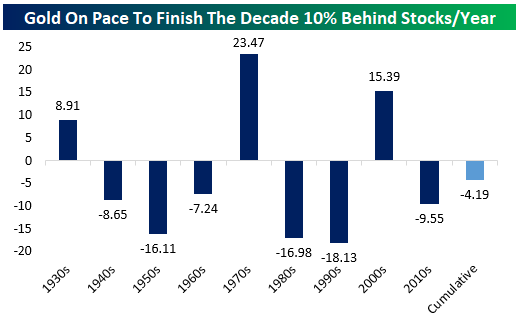
Stocks Crush Rocks
The 2010s have been a rough decade for the yellow metal. As shown in the chart below, since 2009, gold is on pace to lose out to equity market total returns by almost 10%…per year. It’s the sixth decade since the 1920s that the spot price of gold has lagged US equity market total return; over the course of the last 8 decades, the cumulative underperformance is more than 4%…and once again, that’s per year! Given the costs of storing gold, which generally translate to an upward-sloping futures curve (contango), this analysis using spot prices is if anything favorable to gold! In other words, persistent and large asset allocation to gold leads to a substantial underperformance versus stocks, even when putting your hands on the scale in favor of gold. That doesn’t mean investors should never own gold, which can be a useful investment in terms of portfolio construction, but it does suggest that incremental units of gold exposure will reduce returns relative to equities over the long run.
(Click on image to enlarge)
We covered the gold vs. stocks relationship in last night’s post-market macro note — more


