
Silver - Wednesday, Jan. 23
Let’s focus on a longer-term view of the daily candles. The overhead resistance shows that the market is still on a downtrend (and thus the recent bounce from the 14s can be considered a corrective move), but the 200-DSMA (below the market) can work as a good support level even for more long-term oriented positions.
(Click on image to enlarge)
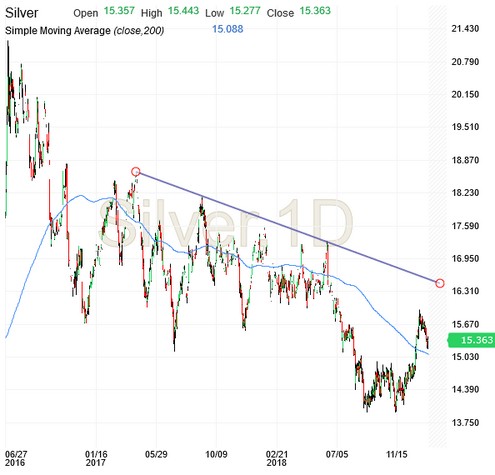
source: investing.com
Disclaimer: All opinions expressed in this blog are solely for information or educational purposes. The blog material does not constitute investment or trading advice. The blog material has no ...
more
How did you like this article? Let us know so we can better customize your reading experience.

Comments
Leave a comment to automatically be entered into
our contest to win a free Echo Show.

