
Silver: Supplies Enter Danger Zone
Fundamentals
The Biden administration and other world leaders’ plans appear to be factored into the price of gold and silver. Although we had heavily shorted stocks, such as GameStop (NYSE: GME), they had a very short-term impact on the market. However, such events are not over. Players are regrouping. We have the potential for an explosive situation in silver, because we are running out of supplies. The only way to get silver now is to pay a high premium. High tech and industry use silver, so they have to buy silver. Cell phones, solar panels and other high tech products use silver. Demand is increasing. The physical tightness in the cash market could eventually invert the spot market, as happened last year and we saw an $80 move between the gold cash and paper markets. Silver is one of the most undervalued assets, but it's thinly traded, so big hedge funds and banks can move the market. They have been shorting the paper market, depressing the price, especially in relation to the increasing demand in the physical market.
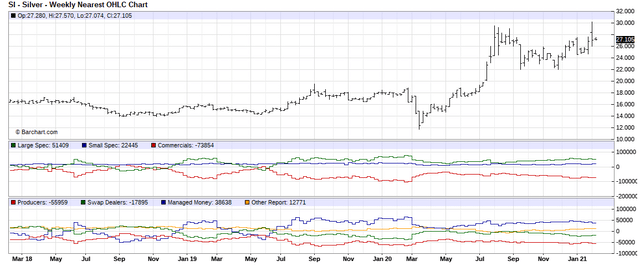
Courtesy: Barchart.com
The 1,000-ounce silver bars are the main type of silver used for industrial demand. If there is a shortage of those bars, then we will know that there is a major shortage of silver and we could see $50 silver very fast.
The gold-silver ratio is in the 67s, which means silver is very undervalued compared to gold. In March, silver collapsed and the ratio hit about 120. We have already seen a 50% drop in silver. This is just the beginning of this move in the precious metals markets. We focus on the technical analysis since based on the fundamentals, prices should be skyrocketing. Central bankers continue to short precious metals and they continue to fall in price. If gold and silver come down, they offer excellent opportunities to buy for the long term.
Gold
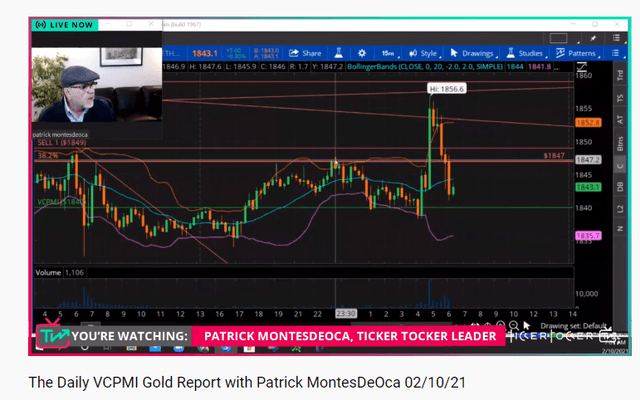
Gold is at $1843.20. We’ve been all over the place with gold. We have resistance around $1849. We came down to the Variable Changing Price Momentum Indicator (VC PMI) average daily price of $1840. Then huge buying interest came in, which activated a bullish trend momentum up through the Sell 1 target and not quite reaching the Sell 2 level of $1859. Then it reverted back down, activating a short trigger reversal. Gold went right down almost to the first target of $1840. We have seen a lot of volatility.
The weekly Sell 1 level is at $1856, and right above that is the monthly average price level at $1874. These levels mark distribution levels of supply. If the market reaches those levels, it is likely to revert. The market from $1849 to $1874 is an area of resistance. The high so far is $1856.60, which is where the market confirmed sellers coming into the market to overtake the demand. The market reverted back down to the support level at $1849--which became resistance once the market went through that price. We have a short signal activated with a target of $1840.
There is a slew of indicators above the market, that unless gold has the muscle to close above $1874, the extreme below the weekly mean, which is $1775, could come into play. The daily target is $1820, if we close below $1840. And $1820 is close to the annual target of $1810.
The past few days, the market offered us the chance to hedge. As the market approaches the weekly or monthly pivot points, it creates a harmonic alignment. The artificial intelligence in the VC PMI is telling us that the levels from $1849 all the way to $1874 offer a high probability of supply coming into the market.
We have a long-term core long position. We hedge that position synthetically, which means we use other derivatives to give us protection if the gold market comes down. If gold rockets up, then we are also not going to miss that, since we are long gold. If we get a reversion, then we would aggressively add to our long positions in gold and silver.
If you are day trading and using multiple positions, we use a trailing stop and lock in our goal of a $300 profit. For a short trade, even if the signal is still short, you want to manage your profits by taking your profits off the table when they reach your pre-set target.
According to Elliott Wave principles, this is the completion of the fourth wave. It's a corrective wave. There's a five-wave pattern, which tested the previous low. We expect the pattern to be completed around $1780 or $1775. $1874 is a formidable pivot level that indicates the power of the demand behind it. If the market goes through that, there is little above it. If there is enough strength to get through $1874, there's a very good chance of a run up to $1917. That's a very big if, but the market will show us where it is likely to go.
Silver
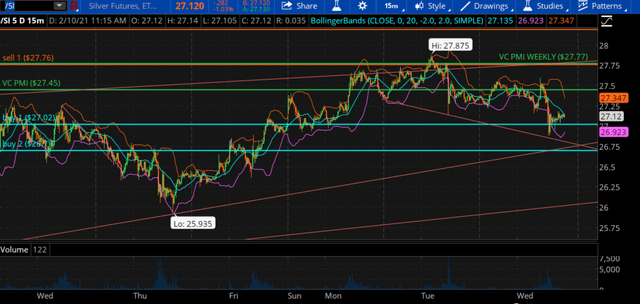
Silver is down about 6 cents. We saw a similar situation as in gold. There's a descending channel with the market breaking above it, which we thought would take us to $27.77.
Disclosure: I am/we are long PSLV. I wrote this article myself, and it expresses my own opinions.
To learn more about how the VC PMI works and receive weekly reports on the E-mini, gold and ...
more

