
Silver Price Outlook: XAG/USD Breaks Out, Can Bulls Drive Rally?
Silver prices jumped up to a fresh two-week-high this morning, showing stark divergence with Gold prices that remain pinned back by resistance. As looked at yesterday ahead of the FOMC rate decision, Gold prices remain in a longer-term case of digestion, but Silver prices have started to show greater resiliency with a touch of additional strength.
This morning’s move brought upon a quick topside breakout after the US opened for business, with prices hurriedly pushing up to the 27.00 level before sellers came into offer supply. That psychological level currently helps to mark resistance.
SILVER FOUR-HOUR PRICE CHART
(Click on image to enlarge)
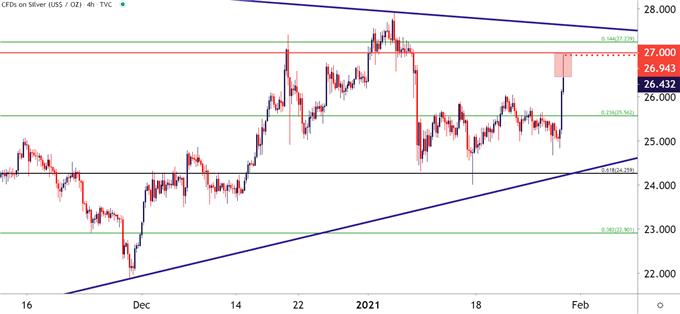
Chart prepared by James Stanley; Silver on Tradingview
On that topic of greater resiliency from what’s been recently seen in Gold, the Gold/Silver ratio is nearing what could be a significant break below the 70.00 level. From the monthly chart below, you can see how the Gold/Silver ratio hasn’t seen extended activity below the 70.00 level since 2016/2017; highlighting the potential for a stronger bid behind Silver v/s Gold, particularly if this short-term breakout can hold.
GOLD/SILVER RATIO – MONTHLY CHART
(Click on image to enlarge)
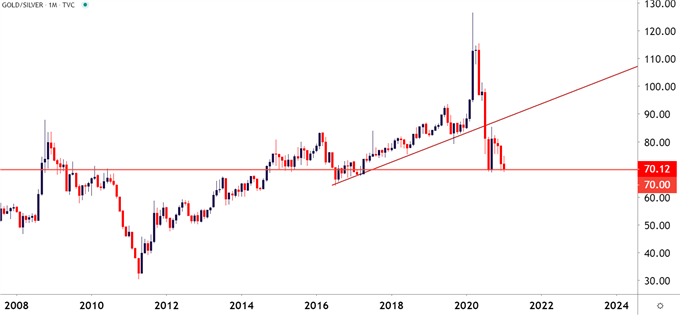
Chart prepared by James Stanley; Gold/Silver on Tradingview
Taking a step back on the Silver chart, and there is a similar case of digestion showing as price action has spent much of the past six months digesting gains from the five months before that. But, from the weekly chart below, you can see the recurrent tests of the 27.00 handle, and the nearing confluence with the resistance portion of that formation. On the underside of price action, there’s been a penchant for support to show around the 24.50-25.00 handle, presenting a box-like formation that can lead to future breakouts.
SILVER WEEKLY PRICE CHART
(Click on image to enlarge)
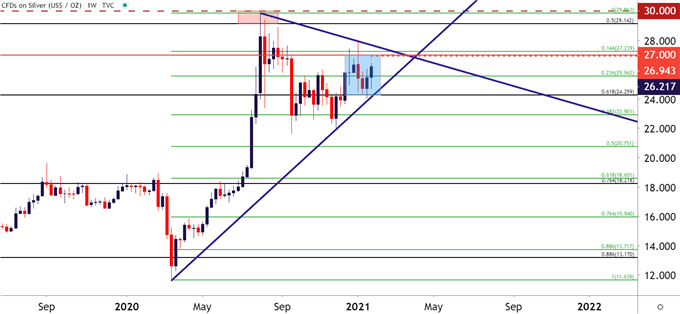
Chart prepared by James Stanley; Silver on Tradingview
SILVER NEAR-TERM – WHAT TO WATCH FOR
At this point, Silver prices remain relatively subdued below these longer-term forms of resistance. But, if buyers are able to breach the zone running from 27.00-27.24, the next level of resistance plots around 27.92, the current five-month-high. A test above that would also amount to a topside break from the triangle, which keeps the door open for further bullish breakout potential.
Beyond that is a big area of resistance around the psychological 30-handle, and this is very near the current seven-year-high. If buyers are able to sustain a break through 30, matters can get very messy very fast.
SILVER DAILY PRICE CHART
(Click on image to enlarge)
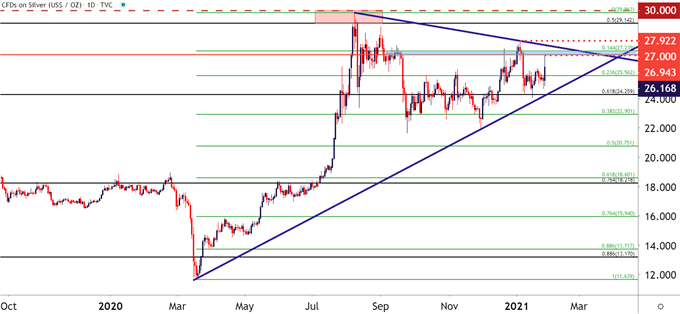
Chart prepared by James Stanley; Silver on Tradingview
Disclosure: See the full disclosure for DailyFX here.


