
Silver Futures Decline Testing Major Fibonacci Support Level
(Click on image to enlarge)
The past four months have been rough for Silver futures. And it may get worse before it gets better if the price of silver doesn’t reverse higher soon!
Today we look at a long-term “monthly” chart of Silver futures and point out an important line in the sand for Silver.
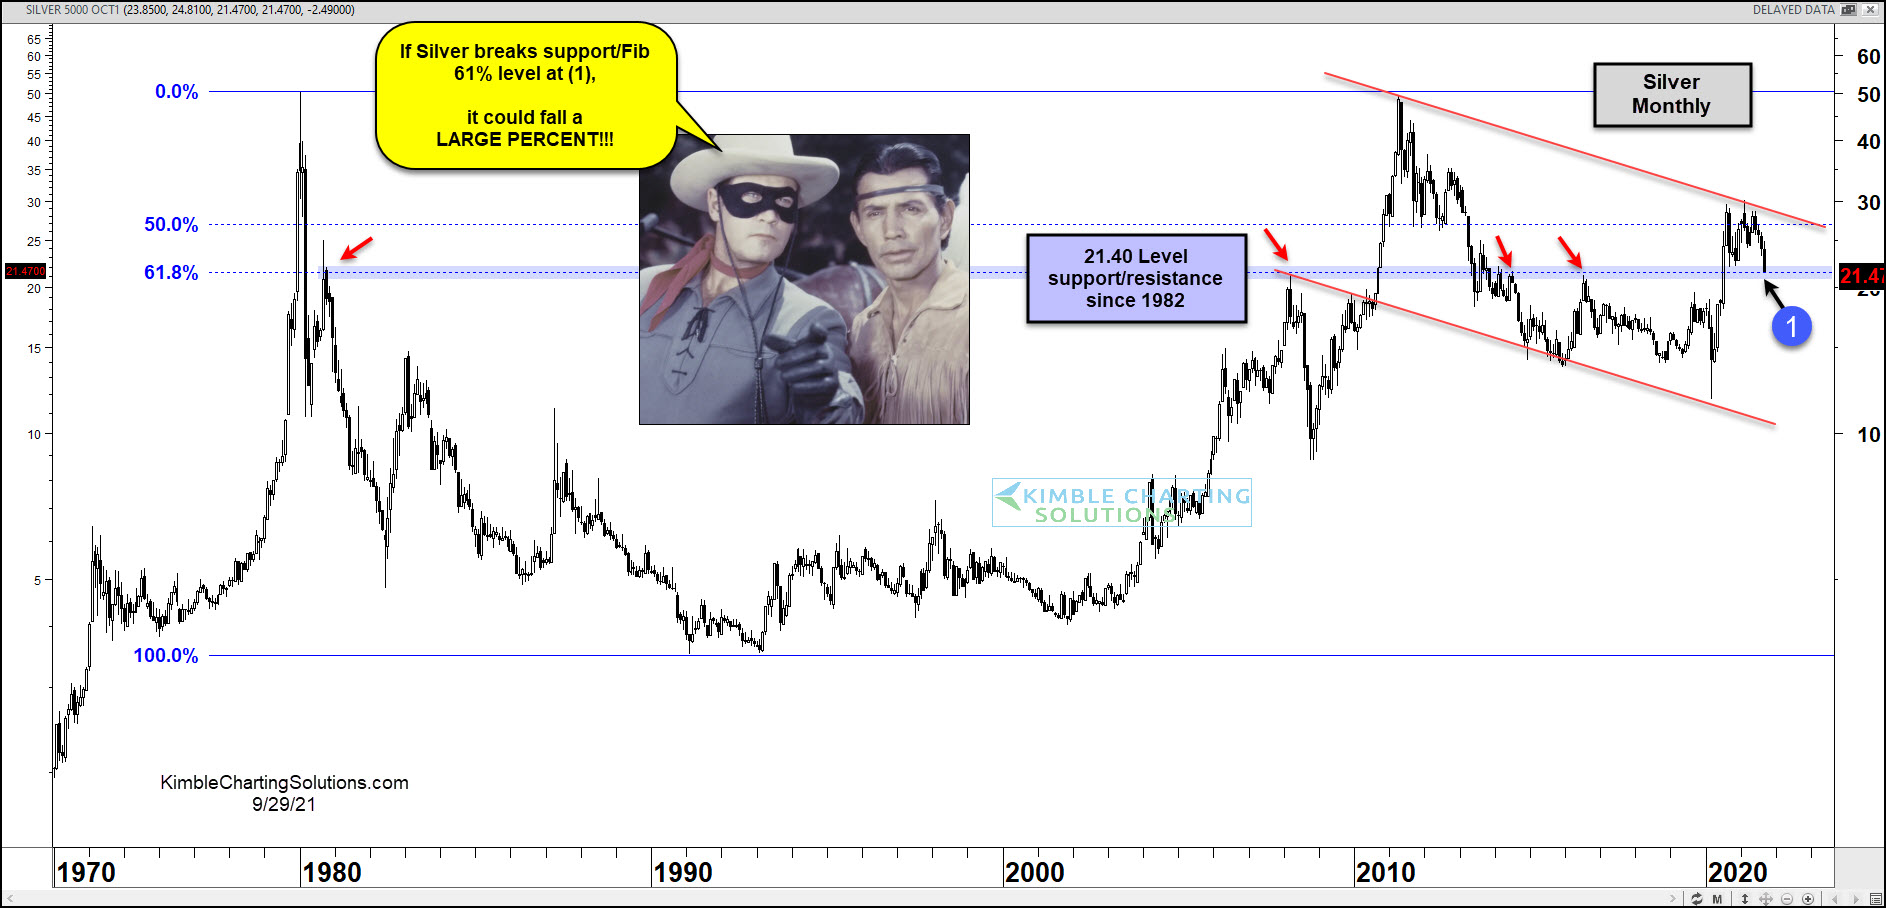
As you can see, Silver has been in a falling channel since testing its 40-year high over 10 years ago. But what’s even more eye-catching is the Fibonacci levels marked using the peak and trough over the past 40+ years.
Here you can see that Silver’s 2020 rally was stopped by the 50% Fibonacci level and downtrend resistance. This lead to the current decline. And now we are testing an even more important Fibonacci level – the 61.8% Fib at (1).
Why? Because this level ($21.40) has marked pivotal price support and resistance 4 times in past history, including 3 times in the past 15 years.
If Silver breaks this key Fib support, it could fall by a large percent!
Disclosure: Sign up for Chris's Kimble Charting Solutions' email alerts--click here.


