Silver - Elliott Wave Technical Analysis
Silver Elliott Wave Analysis
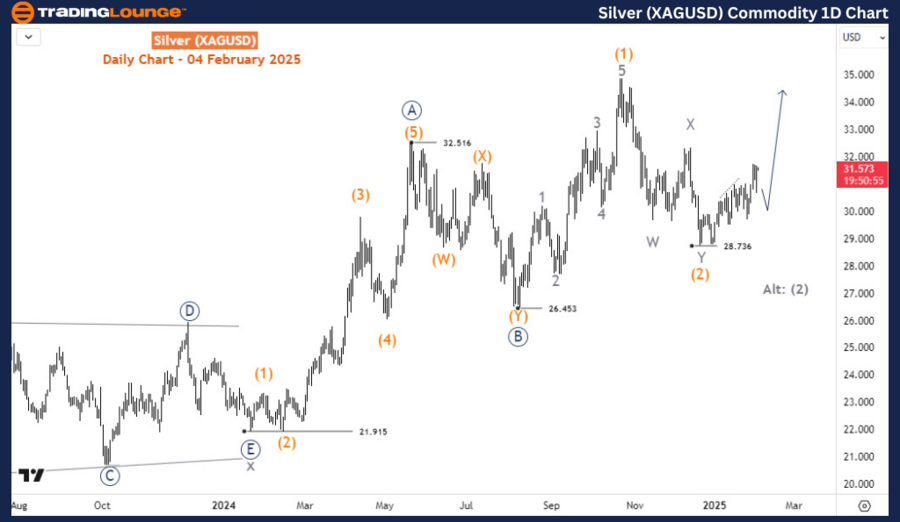
Silver is turning higher from the low of December 2024 where the pullback from October 2024 may have been concluded. However, the commodity now approaches the key resistance zone around the top of 9-12 December highs. Around these prices, a large pullback may ensue. Despite this though, the upside is still well favored.
Daily Chart Analysis
After a multi-year sell-off that lasted between April 2011 and March 2020, Silver prices started a resurgence that has now lasted for nearly 4 years. it remains to be seen whether this bullish sequence will complete a 5-wave structure or a 3-wave structure. By technical projections, Silver prices are expected to extend to 37.4-44.09.
On the daily chart, the price is in wave ((C)) or ((3)). The sub-wave (1) of ((C))/((3)) has finished while wave (2) finished in December 2024 before the current resurgence started. From this low, we are counting wave (3) higher. While 28.7 holds, this wave count is valid. otherwise, a breach below 28.7 would mean wave (2) extending lower.
H4 Chart Analysis
On the H4 chart, the price is confirmed to be in wave ((iii)) of 1 of (3). Wave ((iii)) could extend to 32.75-33.26 before pullback for wave ((iv)) starts. While there is a risk of wave (2) extending lower, recent price action favors the upside to continue along the path of wave (3).
Technical Analyst : Sanmi Adeagbo
More By This Author:
Elliott Wave Technical Analysis: Sonic Healthcare Limited
Elliott Wave Technical Analysis: Costco Wholesale Corp. - Tuesday, Feb. 4
Elliott Wave Technical Analysis: British Pound/U.S. Dollar - Tuesday, Feb. 4
At TradingLounge™, we provide actionable Elliott Wave analysis across over 200 markets. Access live chat rooms, advanced AI & algorithmic charting tools, and curated trade ...
more

.thumb.png.f5b25f08e22258faa66055d7c689e8e1.png)


