
Short-Term Flows Primarily USD Negative
Dashboard: Intermarket Flows & Technical Analysis
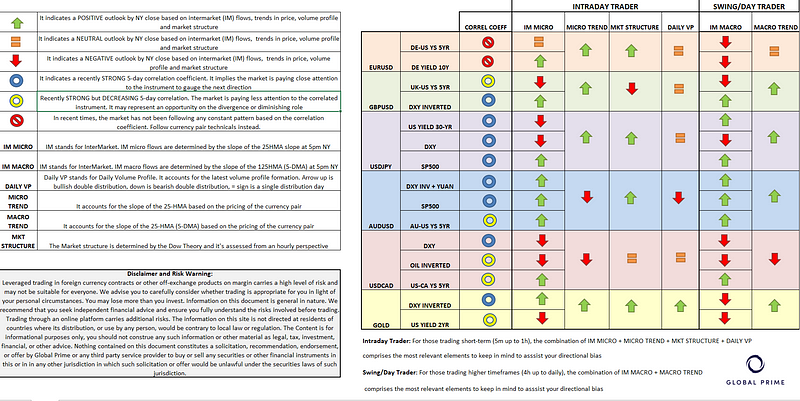
Chart Insights: Intermarket Flows & Technicals
EUR/USD: Range Establishment Post 1.1250 Demand Imbalance
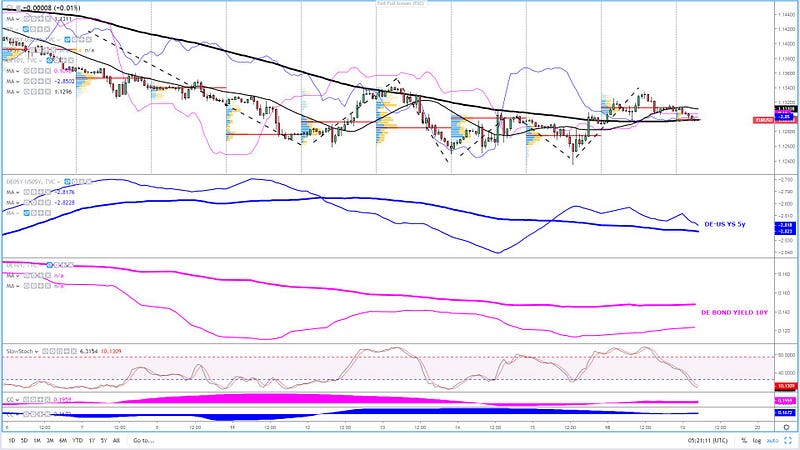
The absence of liquidity in financial markets during Monday is well expressed through the pair’s narrow 35p range. The most traded pair in the forex universe has validated the first up-cycle structure for weeks, even if from a 4h chart and above, it would still warrant caution as the structure is still a wide a 1 cent range between 1.1340–50 down to 1.1250 with 1.13 the anchoring midpoint to pivot from. At the moment, with back-to-back hourly rejections off this round number and a 25-HMA still exhibiting an upward slope, one could make the case for active interest to buy on dips as the hourly cycle pans out. In terms of intermarket flows, there is an absence of cues to be obtained from yield spreads or even the German yield as a proxy for the EU growth outlook as the moves have been extraordinarily stagnant in the last 24h. Even the 5-day correlation coefficients both show an evident detachment between the performance of yields and the EUR/USD price action, which results in a market that is temporarily technically-driven.
GBP/USD: Testing 3rd Touch Of A Descending Trendline
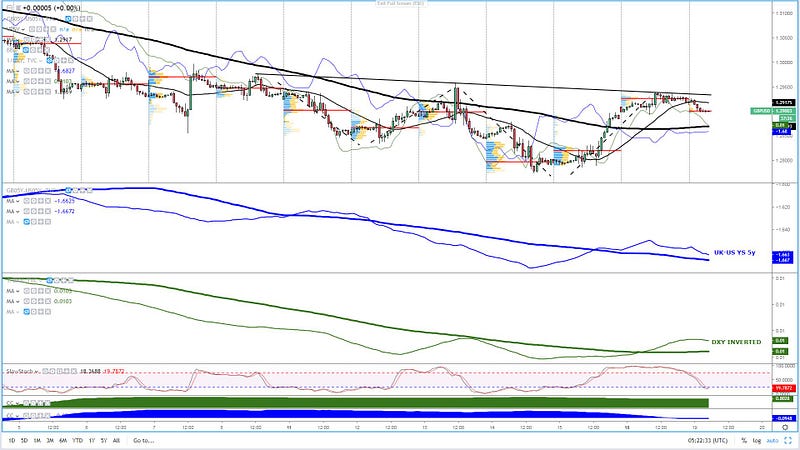
Technically, the Sterling has reached a crossroads as it finds an expected cluster of offers at the 3rd test of a descending trendline originating from Feb 8th’s supply imbalance. The acceptance just under this dynamic resistance is an encouraging sign as it’s the still pronounced bullish slope of the 25-HMA by NY 5 pm as momentum-based intraday strategies keep a lid on the tepid USD demand seen. The consolidation near the highs has also allowed the slow stock to come out of overbought conditions. Scanning through intermarket flows, and taking last Friday’s upward rotations as our guidance given the low levels of trading activity on Monday, we still can observe positive microflows in the DXY as the 25-HMA slope portrays, while it’s also quite encouraging to see the macro flows based on the 125-HMA slope (5-DMA) to officially turn higher as the thick green slope exhibits. One of the factors that may abate the demand imbalance of Pounds vs US Dollar is derived from capital flows, as both the micro and macroflows still show a bearish divergence (blue lines) with the price. For most of February, the 5-day correlation coefficient of the UK-US yield spread has acted as a reliable barometer to take the pulse on the pair’s valuation, that’s why one must pay attention to the current lagging. Overall, it’s a fairly balanced outlook, with cases to be made for either side. In favor of buy-side action is the current technicals and DXY weakness, while sellers’ thesis to short the market could be predicated on the UK-US yield spread divergence and the crucial trendline tested.
USD/JPY: Conflicting Signals As SP500 Offsets DXY/US30Y
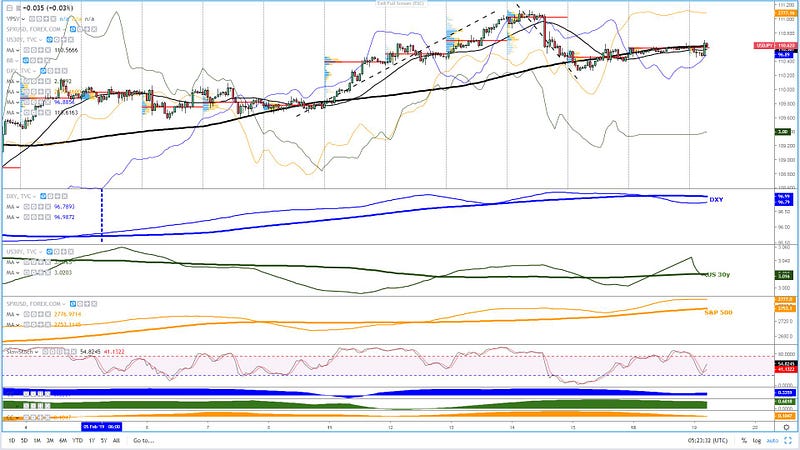
Whenever equities surge the way they did last Friday, under the current market regime, that’s always going to create a supply imbalance detrimental to the JPY. That’s precisely the reason why even if the DXY and the US long-dated yields keep dropping, the pair could find a floor around 110.25–30.I’d argue that as long as the weakening trends in DXY + US30Y stay the course, it’s going to take a lot of buying power in the S&P 500 as the barometer of the equity flows to prevent further cracks in the pair’s technicals. However, if we assume that the S&P 500 is safe to be ticked as a near-term supportive factor for the pair, any intraday recovery in either the DXY and/or US yields may see the propensity for trend followers to jump on the pair’s bullish bandwagon. If the S&P 500 doesn’t show abrupt moves in either side, this is a market where the most reliable cues will be obtained from the behavior of both the DXY and the US long-dated yields. Wait for both to align in the same direction. On the upside, the 50% fib retracement at 110.65–70, the retest of a prior support-turned-resistance at 110.85–90 ahead of 111.00–111.05 (round number + prior trend highs) are the key levels to watch. On the downside, 110.25–30 followed by 110.00–05 are the immediate hourly support areas.
AUD/USD: Bullish Outlook Near-Term Still Justified
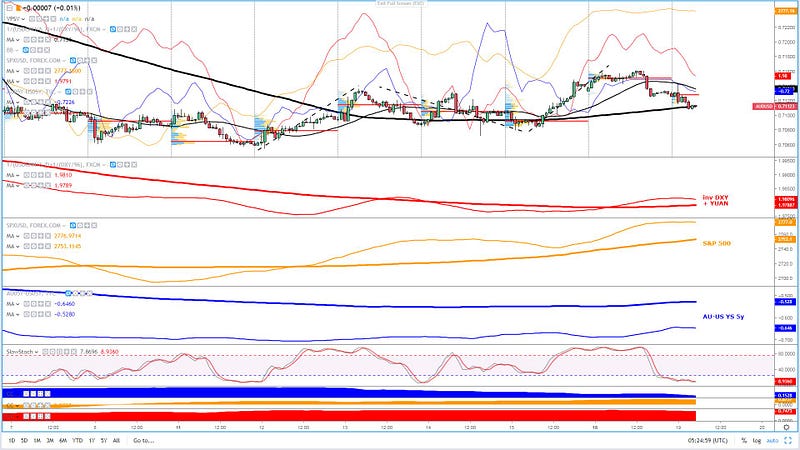
I am going to reiterate what I wrote yesterday. This is the market with the clearest buy-side bias out of the majors analyzed, only challenged by the downside potential available in USD/CAD. The technicals are looking bright from a cycle’s standpoint, with higher highs and higher lows achieved since last Friday. The slow stoch has now come into oversold conditions. But what makes it compelling is to cross-check the status of the intermarket flows to realize the current levels make for an interesting proposition to consider long-side campaigns on the basis of a rising inverted DXY+Yuan (red line), a bullish mood in equities (orange line) while the AU-US 5-yr yield spread stays relatively subdued. The upward slope in the 25-HMA of these correlated instruments is a testament that we are in a discounted opportunity. These are the times when the risk-reward can be the most attractive, that is, whenever intermarket flows still point higher yet the pair can be, in this case, bought at oversold conditions based on the slow stoch measures. At the most granular level, it is down to each individual to decide what strategies are best suited to exploit what I perceive a buy-side opportunity.
USD/CAD: Sell Strength While OIL/DXY Move In Tandem
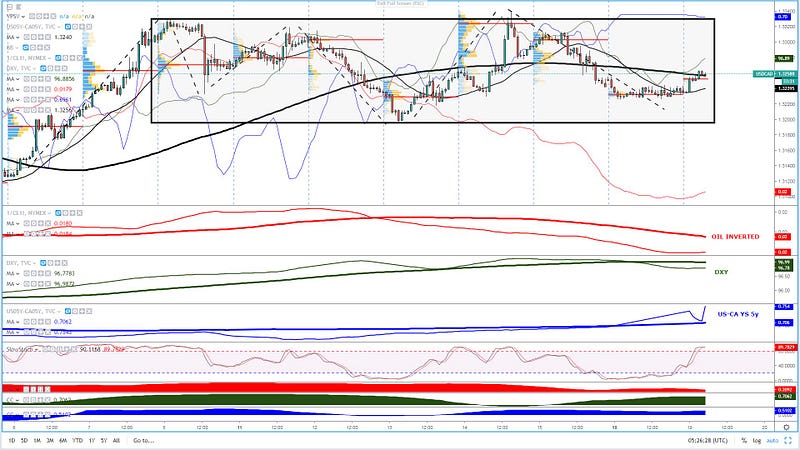
The technical picture has clearly deteriorated and if one buys into the thesis that we are in a 1.3225–30–1.32 range box, the recent trajectory in the pair still suggests another 50 odd pips of downside potential for the pair. The dominant buy-side flows on the Canadian Dollar are conditioned to further weakness in the DXY with Oil being more of a safe bet as even if flows turn against, there is a major divergence with the pricing of the pair, so plenty of catch up to do, especially in a correlated asset that has shown in recent months such a strong relationship. As I mentioned yesterday, as long as the DXY and the inverted Oil prices move down, the aggregate of flows should offset the capital flows derived from the CA-US bond yield spread, currently at the highest since last January. Note, the level of 1.3265 or thereabouts should act as the anchor or midpoint of the range.
NZD/USD: Buy On Dips Preferred As Intermarket Flows Stand
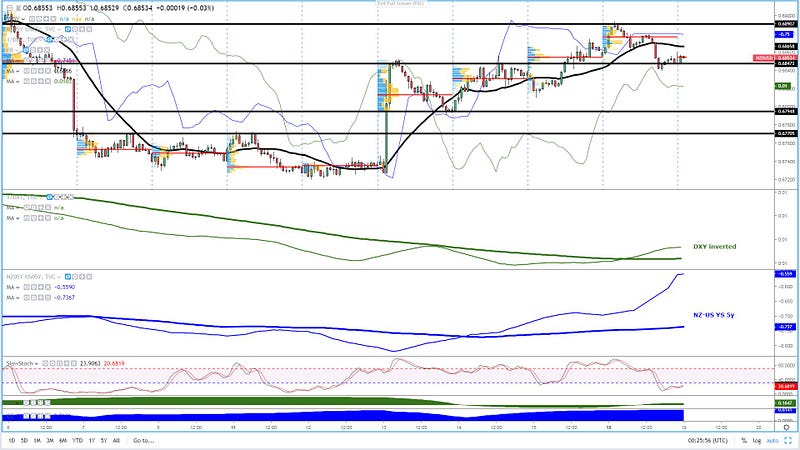
With the technicals undeniably bullish as per the current cycle at play in the hourly chart, the intermarket flows (IMF) are still communicating that this is a market with bullish features as the inverted DXY flows and the recently soaring NZ-US yield spread shows. What’s also interesting is that from a more macro perspective, by accounting for the slope of the 5 — DMA (125-HMA), we are now in a synchronized bullish slope both micro and macro wise, which is a strong buy signal. Unless the inverted DXY slope and or a NZ/US fundamental shocker adjust the yield spread much lower, this market, when aggregating key factors (technicals, intermarket flows), hints at buy dips.
Gold: Breaks Into Fresh Highs, Momentum Behind But…
A stellar 3-day run in gold has taken us to fresh yearly highs. The strength in the price has front run the mild weakness in the DXY (green line). Gold also shows a significant divergence with the US 2-yr yield (blue line), which tracks very closely the Fed funds contract as a proxy to gauge the pricing of the future rate settings by the Fed. Judging by the 5-day correlation coefficient in the DXY (in green), it is this instrument the market has paid the most attention as of late. The US 2-yr yield also agrees. Therefore, it makes me think that the run higher may be getting ahead of itself. If one checks the slow stoch indicator, we remain in overbought territory, which makes buying on such strength a high risk, low reward strategy unless one’s system is based on scalping or short-term momentum basis. If that’s the case, the momentum is certainly very strong, a testament of that is that ever since the onset of the bullish run from 1,307.00 on Feb 14th, the 25-HMA has not been tested.
Important Footnotes
- Risk model: The fact that financial markets have become so intertwined and dynamic makes it essential to stay constantly in tune with market conditions and adapt to new environments. This prop model will assist you to gauge the context that you are trading so that you can significantly reduce the downside risks. To understand the principles applied in the assessment of this model, refer to the tutorial How to Unpack Risk Sentiment Profiles
- Cycles: Markets evolve in cycles followed by a period of distribution and/or accumulation. The weekly cycles are highlighted in red, blue refers to the daily, while the black lines represent the hourly cycles. To understand the principles applied in the assessment of cycles, refer to the tutorial How To Read Market Structures In Forex
- POC: It refers to the point of control. It represents the areas of most interest by trading volume and should act as walls of bids/offers that may result in price reversals. The volume profile analysis tracks trading activity over a specified time period at specified price levels. The study reveals the constant evolution of the market auction process. If you wish to find out more about the importance of the POC, refer to the tutorial How to Read Volume Profile Structures
- Tick Volume: Price updates activity provides great insights into the actual buy or sell-side commitment to be engaged into a specific directional movement. Studies validate that price updates (tick volume) are highly correlated to actual traded volume, with the correlation being very high, when looking at hourly data. If you wish to find out more about the importance tick volume, refer to the tutorial on Why Is Tick Volume Important To Monitor?
- Horizontal Support/Resistance: Unlike levels of dynamic support or resistance or more subjective measurements such as fibonacci retracements, pivot points, trendlines, or other forms of reactive areas, the horizontal lines of support and resistance are universal concepts used by the majority of market participants. It, therefore, makes the areas the most widely followed and relevant to monitor. The Ultimate Guide To Identify Areas Of High Interest In Any Market
- Trendlines: Besides the horizontal lines, trendlines are helpful as a visual representation of the trend. The trendlines are drawn respecting a series of rules that determine the validation of a new cycle being created. Therefore, these trendline drawn in the chart hinge to a certain interpretation of market structures.
- Correlations: Each forex pair has a series of highly correlated assets to assess valuations. This type of study is called inter-market analysis and it involves scoping out anomalies in the ever-evolving global interconnectivity between equities, bonds, currencies, and commodities. If you would like to understand more about this concept, refer to the tutorial How Divergence In Correlated Assets Can Help You Add An Edge.
- Fundamentals: It’s important to highlight that the daily market outlook provided in this report is subject to the impact of the fundamental news. Any unexpected news may cause the price to behave erratically in the short term.
- Projection Targets: The usefulness of the 100% projection resides in the symmetry and harmonic relationships of market cycles. By drawing a 100% projection, you can anticipate the area in the chart where some type of pause and potential reversals in price is likely to occur, due to 1. The side in control of the cycle takes profits 2. Counter-trend positions are added by contrarian players 3. These are price points where limit orders are set by market-makers. You can find out more by reading the tutorial on The Magical 100% Fibonacci Projection
The Daily Edge is authored by Ivan Delgado, Head of Market Research at Global Prime. The purpose of this content is to provide an assessment of the market conditions. The report takes an in-depth ...
more

