
Saudi Arabia Triggers Oil Price War With Russia! What’s The Trade?
Energy traders have been left stunned after oil prices crashed more than 30%, triggered by an oil price war between Russia and OPEC giant Saudi Arabia. The move sent stocks crashing even lower amid the wider economic issues from the coronavirus pandemic. The Russian ruble also plummeted with the currency hitting its lowest level in more than four years.
With investment bank Goldman Sachs sounding the alarm bell of a "completely changed outlook" in oil, we discuss the situation in more detail and the trading opportunities around this historic event.
The story of Saudi Arabia, Russia, oil and retaliation
In the latest OPEC+ meeting in Vienna, Russia decided to end its four-year alliance of cutting oil production after refusing to agree to new limits of global production. OPEC giant, Saudi Arabia wanted to curtail oil production in line with a global demand slowdown due to the coronavirus impact.
In response to Russia not agreeing to new production cut limits, the Saudis offered discounted rates to key buyers in direct competition with Russia and in an attempt to corner the market. Saudi Arabia also ordered its state-owned oil product Saudi Aramco - the world's most profitable company - to raise the maximum production rate to record highs of 13 million barrels a day.
Oil prices tanked 30% to around $35 per barrel on the news and while Russia's energy minister, Alexander Novak, has not ruled out further talks with OPEC, both sides are prepared to weather a prolonged price rout. However, while Saudi Arabia has the lowest production costs in the world much of the kingdom's revenue comes from oil prices and it's reported it needs oil prices to be around $50 - $60 a barrel to support its state's finances.
Russia's production costs are higher but it is argued that its economy is more diverse and is arguably more resilient to a downturn in the oil market. However, oil companies Shell and BP dropped about 20% on the news and raised concerns over their dividend payments to investors, as they struggle to cope with lower demand for oil, a price war to the bottom between Russia and Saudi Arabia and a global stock market rout.
Which markets have been most affected by the oil price war?
Commodities, currencies and stocks have all been affected by the oil price war which could easily escalate into a prolonged rout. The most obvious market affected has been crude oil, both the Brent and West Texas Intermediate (WTI) blends.
1. WTI Crude Oil
Below is the long-term monthly price chart of WTI:
(Click on image to enlarge)
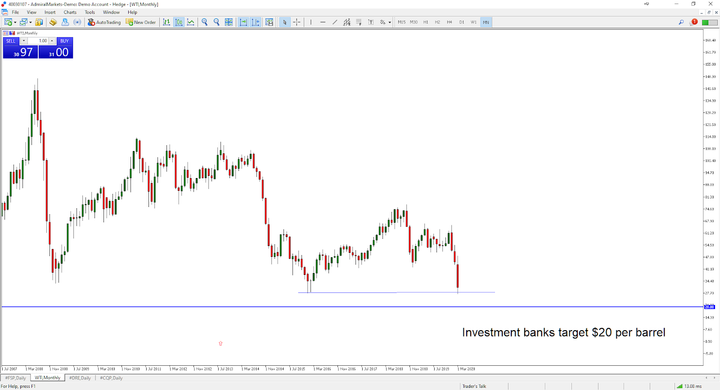
Source: Admiral Markets MetaTrader 5, WTI, Monthly - Data range: from 1 July 2007 to 12 March 2020, accessed on 12 March 2020 at 8:45 am GMT. Please note: Past performance is not a reliable indicator of future results.
With Admiral Markets you can speculate on the price direction of WTI crude oil by using a CFD (Contract for Difference) which allows traders to go long and short on the market. Recently, there has been more short sellers in the market than buyers. The oil price fall was contained at the previous, multi-year low in 2015. However, investment banks such as Goldman Sachs are forecasting oil prices to reach $20 per barrel which is still a significant move lower.
However, there are going to be key buyers - mainly in China - looking to snap up cheap oil. Other major buyers such as airlines may choose to stockpile at these levels but they are struggling with lower demand due to the impact of the coronavirus. This adds more to the probability of further downside in oil prices.
2. British Petroleum (BP)
Below is the long-term chart of BP's share price:
(Click on image to enlarge)
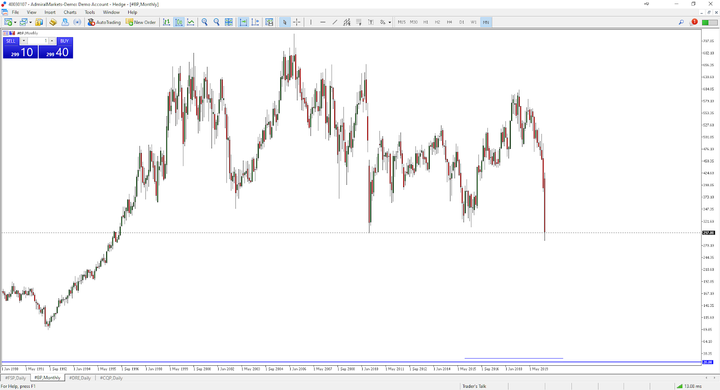
Source: Admiral Markets MetaTrader 5, BP, Monthly - Data range: from 1 January 1990 to 12 March 2020, accessed on 12 March 2020 at 9:45 am GMT. Please note: Past performance is not a reliable indicator of future results.
It's clear to see the struggles in BP's share price all the way back since 2000. While there have been some significant mini-trends over the years, the share price has remained range-based for some time. Even before weaker oil prices and the global stock market rout, investors have been shunning energy giants for smaller companies that could be the next big power in alternative energy and climate-friendly resources.
While the recent price fall has been contained at the low of 2010, a break below here could send BP's share price tumbling towards lows not seen since 1992. Hence, the dividend warnings by both oil giants BP and Shell.
3. Russian Ruble
Below is the long-term price chart of the US dollar against the Russian ruble (USD.RUB):
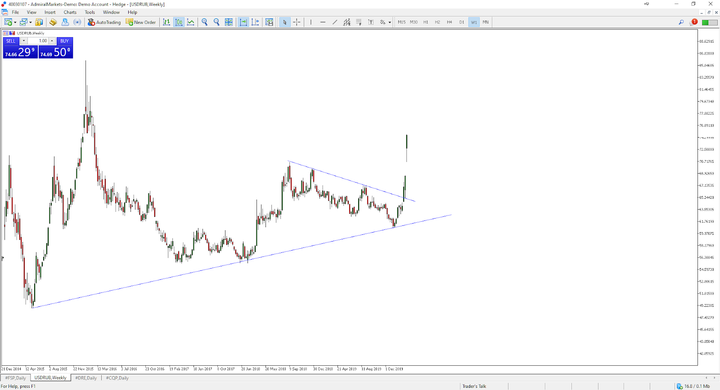
Source: Admiral Markets MetaTrader 5, USDRUB, Weekly - Data range: from 21 December 2014 to 12 March 2020, accessed on 12 March 2020 at 10:45 am GMT. Please note: Past performance is not a reliable indicator of future results.
The recent surge higher in USD.RUB means that the US dollar has strengthened while the Russian ruble has weakened. Lower oil prices mean less revenue for Russia which the markets are now saying is not good for its currency. From a technical analysis standpoint, the currency has not only bounced higher from a long-term ascending trend line but it has also broken through a key resistance line which started from 2018.
While analysts say Russia could survive an oil price war better than Saudi Arabia, it does not mean there will not be any pain for the country's finances and currency. If things continue as they are, traders will be eyeing the highs of 2015 which represents significant upside from current levels.
Conclusion
The oil price war between Russia and Saudi Arabia has created some highly volatile moves across different asset classes. While volatility is still high, it's evident that some long-term trends are potentially coming into fruition. The key question is how will you be trading it?
Disclaimer: The given data provides additional information regarding all analysis, estimates, prognosis, forecasts or other similar assessments or information (hereinafter "Analysis") ...
more

