
Russia Halts Record Gold Purchases! Can It Still Surge 20% Higher?
Behind the scenes in the price of gold, London dealers have been noticing unprecedented, historic events unfolding. Liquidity issues in the London market, unwinding of leveraged bets in gold ETFs and the exodus of gold's largest buyer, Russia, have all shocked the market that is usually seen as a safe-haven in troubling times. However, with the price of gold just 20% away from its all-time high some analysts still remain bullish. In this article we analyse the situation and what could happen next.
"The gold market is breaking down"
So says Saxo Bank's head of commodity strategy, Ole Hansen. The coronavirus has caused major logistical problems for the delivery of physical gold while demand has ramped up at the same time. The closure of three Swiss refiners has also placed a further squeeze on supply.
All of these issues have created an explosive mix of volatility in the market with the price of physical gold decoupling from the price of paper gold. The liquidation of leveraged funds scrambling to cover margin calls in the historic stock market crash has thrown even more fuel to the fire.
The London Bullion Market Association, the world's most important authority for physical gold, issued a statement to Kitco saying that while the London gold market is open for business there has been some impact on liquidity arising from price volatility in the Comex Gold futures contract.
All of these factors have helped to contribute a divergence in the spot price of gold and the futures price of gold. The difference in these prices has been the widest for four years, as seen in the chart below:
(Click on image to enlarge)
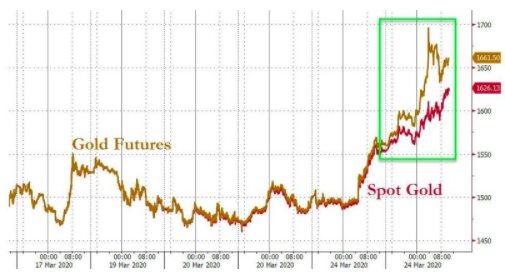
Source: ZeroHedge
It's just one reason why the spread of the gold price on many trading platforms has widened in recent weeks. Many traders point to the fact that when the futures market is trading at a premium to the spot market it means that traders believe the price of the asset will be worth more in the future. In this case, many analysts are taking this historic event as a sign of further upside yet to come in gold.
However, some analysts point to the changing philosophy of Russia, one of gold's biggest buyers in recent years, as a cause for concern.
Gold's Russian exodus
Until this week, the Russian central bank had been snapping a large portion of the world's gold production, spending an estimated $40 billion over the last five years to build a stockpile of 2,279.2 tons of the metal. This makes Russia the sixth largest holder of the yellow metal, behind France with 2,436 tons and Italy with 2,451.8 tons. The US holdings dwarf all of these combined with 8,133.5 tons held in the Fort Knox and other vaults in the US and around the world.
It's widely known that Russia has been buying up gold as a way to cut its country's exposure to the US dollar in its official reserves. However, the collapse in oil prices and the current oil price war with Saudi Arabia has meant Russia now needs access to cash.
Last year in September 2019, the Washington Agreement, also known as the Central Bank Gold Agreement, came to end. For 20 years this agreement helped to limit central banks to collective selling of 400 tons of gold a year with a ceiling of 2,000 tons over a five-year period. While many analysts simply point to the coincidence of these factors, it's clear that the biggest move in gold - up or down is still yet to come.
Identifying trading opportunities in the chaos…
With Admiral Markets, users can speculate on the price direction of gold using CFDs or Contracts for Difference, commission-free. This allows you to trade both long and short, thereby potentially profiting from rising and falling markets. As markets are inherently volatile, it's important to always use a stop-loss to manage the size of any losses.
Below is a long-term, monthly price chart of Gold:
(Click on image to enlarge)
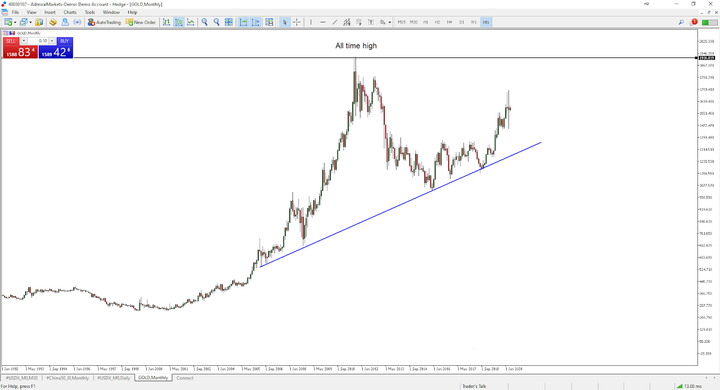
Source: Admiral Markets MetaTrader 5, Gold, Monthly - Data range: from 1 January 2002 to 2 April 2020, accessed on 2 April 2020 at 10:17 am GMT. Please note: Past performance is not a reliable indicator of future results.
It's clear to see the long-term, uptrend bias in the price of gold with the most significant decline between 2012 and 2016. Since 2016, the price of gold has been slowly making its way higher, helped by the ascending support line denoted by the blue line. This type of ascending support line is known as a trend line and is often used by traders to help identify who is in control of the market (buyers or sellers), as well as to identify price levels to trade from.
While price may pullback to the trend line, many traders will now be eyeing the all-time high price level of $1,919 made in September 2011. While the technical picture remains bullish with buyers still firmly in control, the fundamental picture remains more mixed. Investors are eager to get back into the stock market which has declined significantly from the impact of the coronavirus. However, any signs that the virus continues to spread may cause investors to remain in safe-haven asset classes like gold.
From a trading perspective, it can help to change the time frame to find more clarity in the battle between buyers and sellers. Below is a daily price chart of gold:
(Click on image to enlarge)
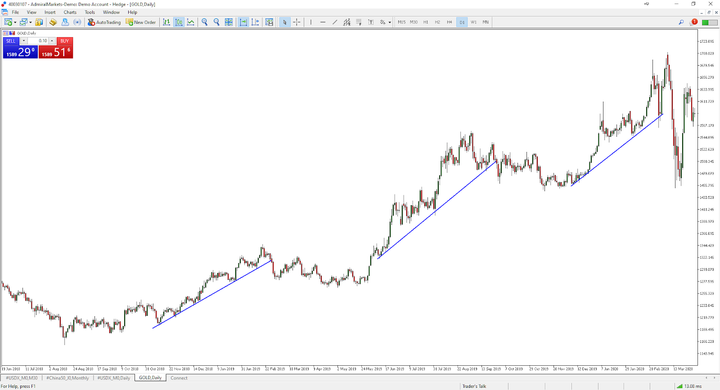
Source: Admiral Markets MetaTrader 5, Gold, Daily - Data range: from 19 June 2018 to 2 April 2020, accessed on 2 April 2020 at 10:27 am GMT. Please note: Past performance is not a reliable indicator of future results.
Viewing the daily price chart allows us to see how the market has moved higher (as seen from the monthly chart before) in more detail. Using the simplicity of a trend line can help to identify further points of clarity on this lower timeframe. In the chart above, the blue line shows periods of time where price was supported by an ascending trend line support. If the market cycles can begin to move in this fashion once again, it may provide the much needed clarity to continue to trade this move to the up side. If the fundamental picture can also provide more clarity during this time, then the all-time high price level of gold may well become a reality this year. How will you be trading it?
Disclaimer: The given data provides additional information regarding all analysis, estimates, prognosis, forecasts or other similar assessments or information (hereinafter "Analysis") ...
more

