
Overbuilding And Leverage Suggest Deflationary Forces Still Dominate
After rising 90% from its March 2020 low, the Bloomberg Commodity Spot Index (below), which tracks 23 energy, metals, and crop futures contracts, yesterday surpassed its previous all-time (fleeting) highs touched in 2011 and 2008.
(Click on image to enlarge)
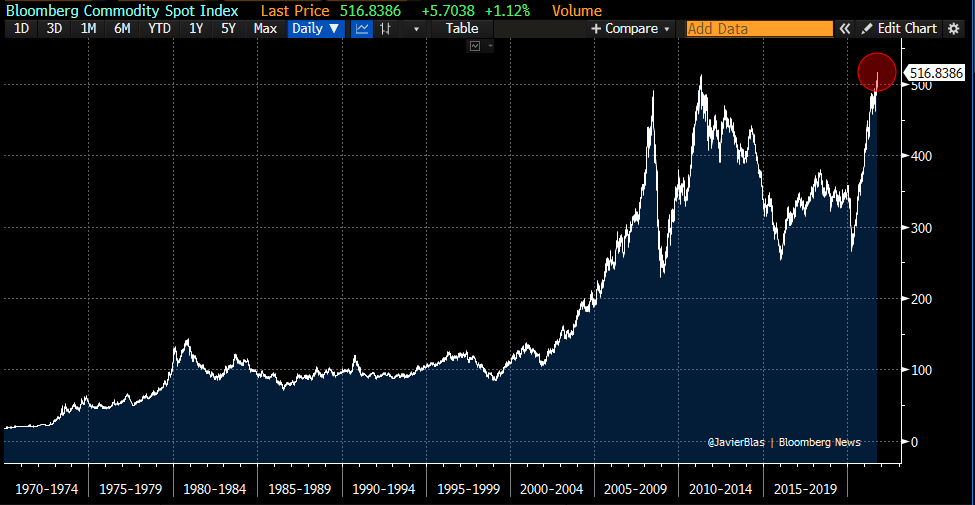
Oil and gas prices (which make up 39% of the CRB index) have led the way, even as less cartel-manipulated commodities have fallen since May: iron ore is -47%, copper -13%, palladium -36%, not to mention lumber -63%. One thing is for sure, higher fuel costs, especially heading into the northern hemisphere winter, will crimp the consumer discretionary spending upon which developed economies presently depend.
China has used some 40 to 50% of many minerals and agricultural products globally over the past two decades. First, to build products for western exports (as China joined the WTO in December 2001), and then, since the 2008 financial crisis, to build out domestic infrastructure and property development.
As excesses have become glaring and socially destabilizing, Beijing now seeks to reduce financial leverage with restrictions on the amount developers can borrow and, yesterday, with a new ban on loans to speculate in commodities. As shown below, since 2013, the Chinese credit impulse (movement of credit through the banking system in dark blue) has been contracting since last spring and typically leads global commodity prices with a lag of 12 months. The present levitation in commodity prices stands ominous.

As property development has become the most significant driver of China’s economy in recent years (responsible for an estimated 29% of GDP), China itself has driven the largest share of global economic growth, about a third overall.
Within the property sector, Chinese residential spending (construction, renovation and transaction costs) accounted for a record 10% of its GDP in 2020, as shown below, and compares with just over 6% for this sector at the peak of America’s 2007 housing bubble. Unfortunately, Canada shares the dubious distinction of a similar 10% of GDP now coming from residential property spending of late, as I explained here in Lethal levels of financial leverage are highly contagious.

While Treasury yields have risen with energy prices over the past two months, higher interest rates are a growth-depressing headwind for highly levered economies. The deflating world economic surprise index (below in blue) suggests the run-up in rates (US 10 year yield in red) should be short-lived.

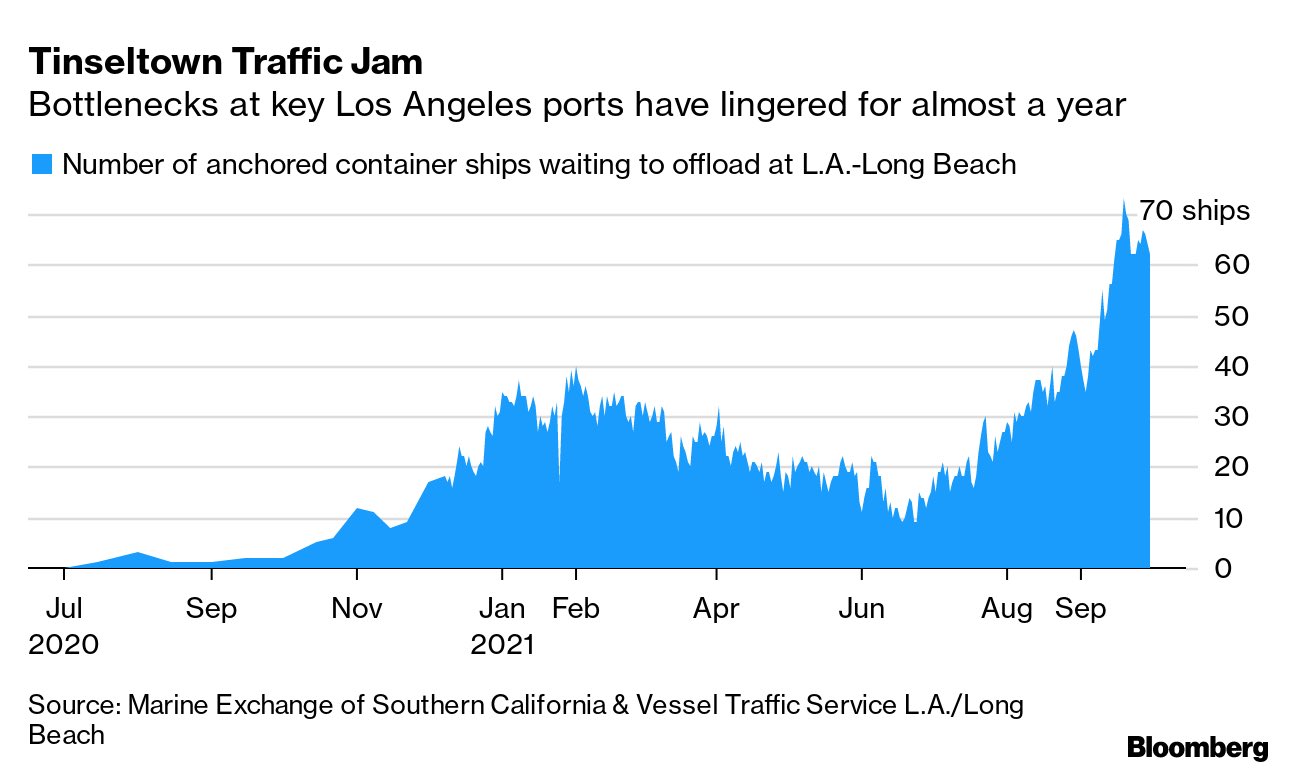
As demand has already turned down from government-boosted spending, a record number of tanker ships are now waiting to unload their cargo at American ports (LA port below in blue).
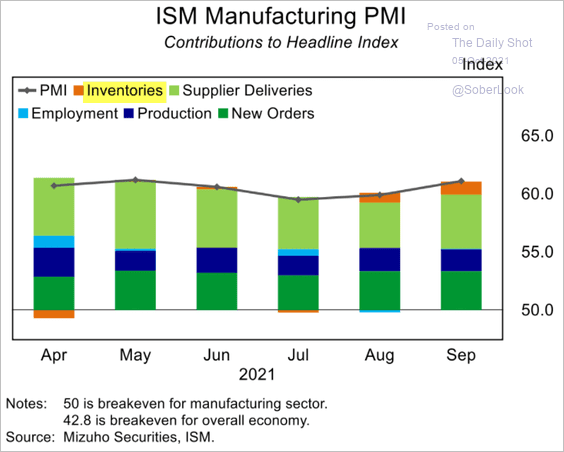
All of this suggests that the inventory rebuilding that began in August and September (see orange below) will continue–similar to what happened in 2008 and 2000 (after the Y2K spending splurge)–and deflationary forces will resume domination over a world awash in goods and short on free cash flow.
Disclosure: None.


