
Outlook For Oil Remains Bearish
(Click on image to enlarge)
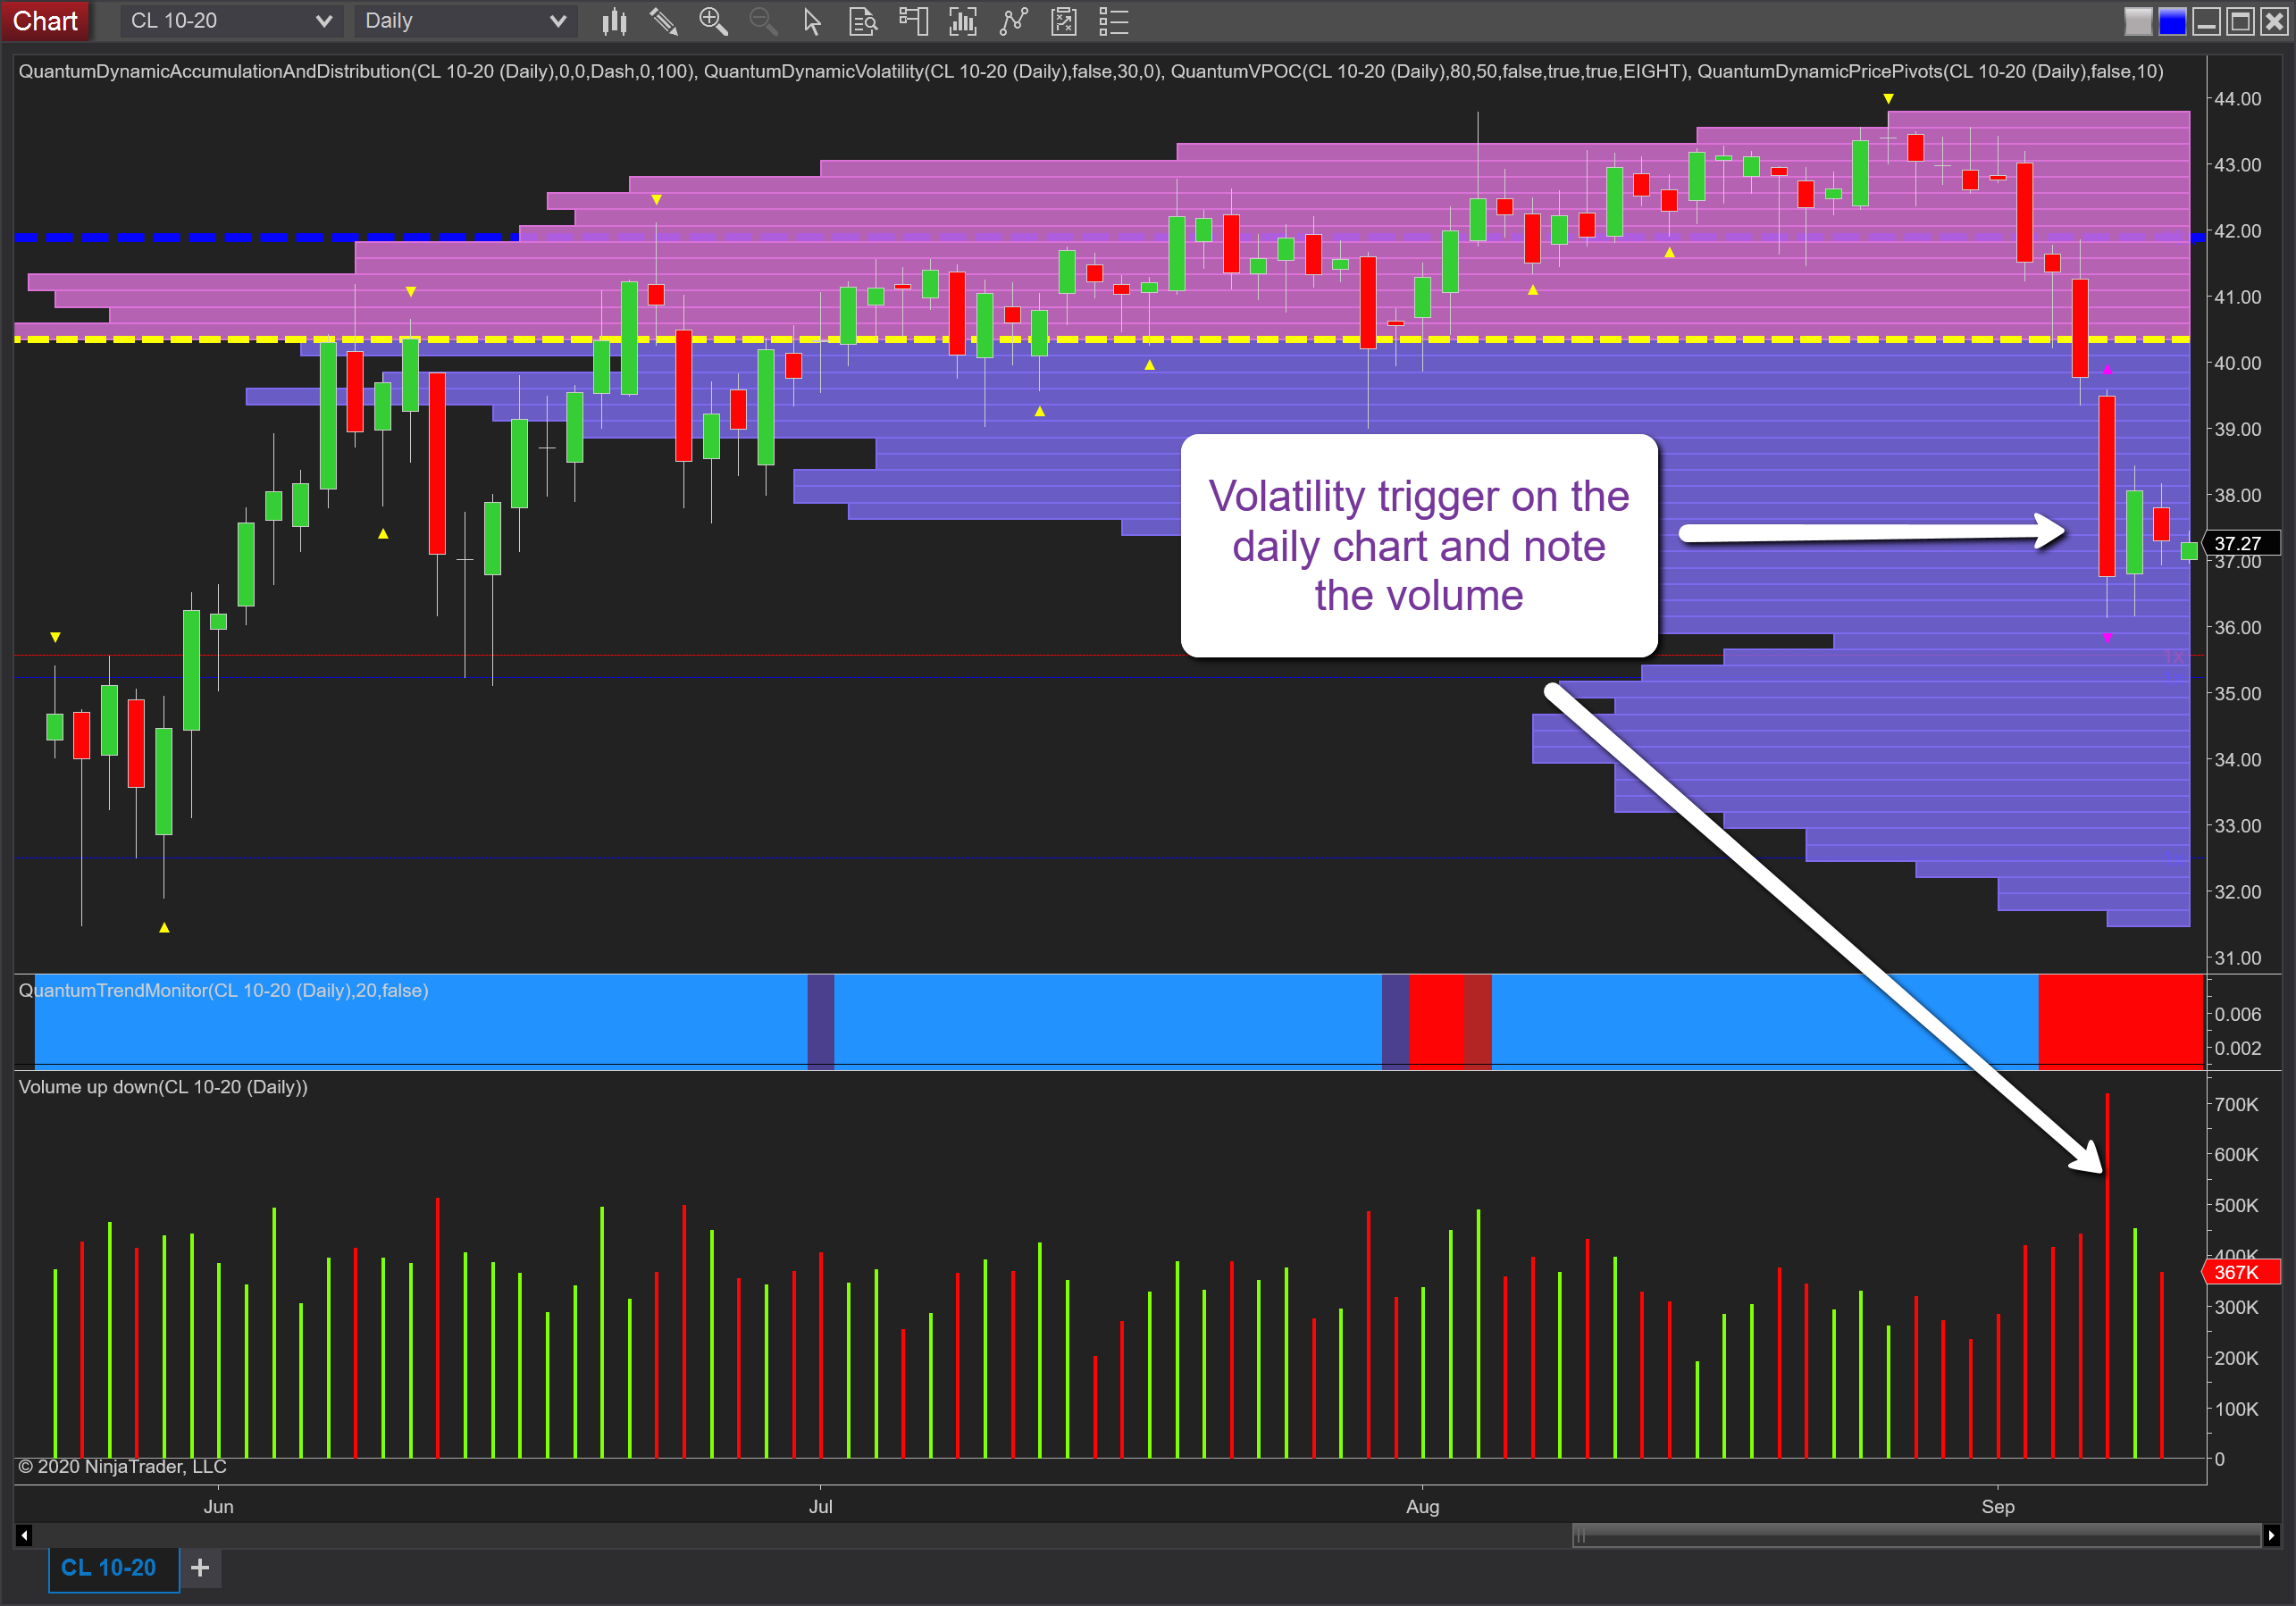
At the start of the week, I suggested the daily chart for the WTI oil future was looking weak and likely to test support around the $36 per barrel area in due course, which is precisely where we are today following the sharp sell-off on Tuesday. As we can see, Tuesday’s dramatic move was associated with ultra-high volume confirming the strength of selling, and in addition, also triggered the volatility indicator on the NinjaTrader platform. This is an indicator that works on the average true range and so appears when the price action moves outside this metric. What we expect to see thereafter is one of two things, namely either a reversal or congestion and to date, we are seeing the latter, with the effort to rally failing to follow through with the commodity reverting lower to trade at $37.60 per barrel at the time of writing. The question now is where is the price of oil heading next?
In the short term note, the trend monitor has transitioned from bullish to bearish and confirming the current weakness. In the short term, if the $36 per barrel level is tested again, this could be the trigger for a move lower as we have a low volume node on the volume point of control histogram, but once through here, volume begins to rise once more and so may provide some support in the $34 per barrel region with $32 then on the horizon.
Disclaimer: Futures, stocks, and spot currency trading have large potential rewards, but also large potential risk. You must be aware of the risks and be willing to accept them in order to invest in ...
more

