
Oil/Energy Companies As Inflation Hedge
“Davison” submits:
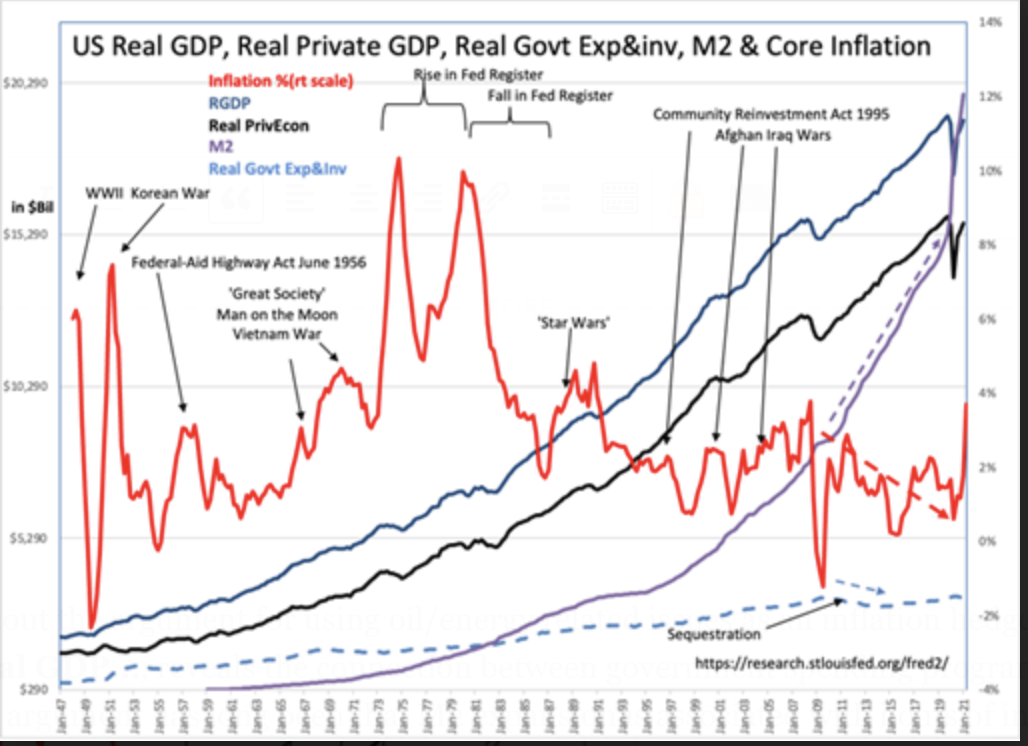
Six charts lay out the argument for using oil/energy-related issues as an inflation hedge. The first chart, US Real GDP…, reveals the connection between government spending programs, M2, and inflation. The argument has long been that M2 expansion is associated with bouts of inflation and often consumer spending is blamed. The argument has been that consumers, flush with cash from economic expansion and wage gains, demand goods driving prices higher. In actual practice, consumers are far more sophisticated and are the primary deflationary influence in economic activity. M2 expansion due to meeting consumer demand is deflationary.
(Click on image to enlarge)
Wage earners are always careful spenders of income and will often put off acquiring goods/services till they identify the best value and function for advancing their standard of living. The successes of the iPhone and Amazon in locating information and acquiring the best options at the lowest cost should make this clear as a driving force of consumer behavior. In a competitive marketplace, it is consumers who drive the successful introduction of innovations through careful evaluation and selection. In the simplest of terms, it is consumer propensity to seek the best value for earned income which is the driver. The M2 expansion due to business borrowings is replaced by equity as successful businesses pay-off debt with profits when consumers seek their innovations. M2 increases currency which is replaced over time with equity in a deflationary process. The M2 currency expansion by unsuccessful companies result in default with currency being written off by investors.
On the other side of the consumption equation is government spending via debt issuance and M2 expansion. It is often in the desire to support political patronage as part of the desired outcome that the cost for value received becomes inflationary. Often part of the equation is expediency as needed in emergency situations, i.e., natural disaster responses and wars.M2 expansion due to government spending is nearly always inflationary. Little effort is made to receive the lowest cost for the goods required. M2 expansion by the government has never been replaced by equity in a deflationary process. The new debt/currency remains outstanding diluting existing equity. M2 expansion due to government transfer payments, i.e. Social Security, unemployment benefits and etc., is partially inflationary because the actual spending decisions are made by recipients seeking highest value for funds available. In US Real GDP… major government programs correlate with the highest rates of inflation while oil prices do so after inflation is apparent. In other words, investors price oil and related industries higher once they fear further inflation.
It remains to be seen how high inflation will prove to be with current government policies. In my analysis, Real Private GDP which is Real GDP subtracting out Real Govt&Exp is the better measure of core economic growth. When M2 growth exceeds Real Private GDP, currency growth outpaces the equity added to society. This dilutes equity which consumers experience as inflation. M2 has grown 40%+ in 12mos and threatens to expand with additional government actions. Inflation is likely to be higher than witnessed the past 40yrs. It may be longer and more persistent than the 1970s. Energy and raw materials the favored inflation hedge once this is apparent are likely to be the preferred inflation hedge once again.
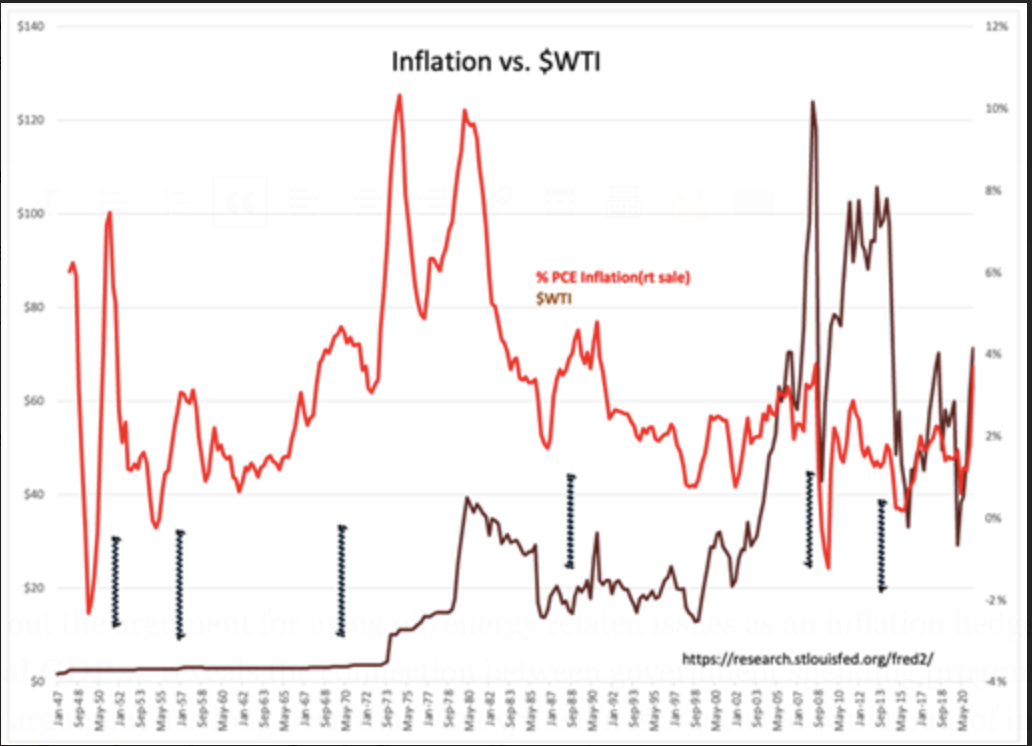
The recent rise and fall of commodity prices has reinforced the belief that demand creates inflation through rising commodity prices. Inflation vs. WTI reveals that many bouts of inflation, indicated with the markers, have occurred without price rises in WTI. Nonetheless, oil prices are incorporated in economic thinking as the cause of inflation, an indicator of economic activity and triggers in algorithmic trading programs. While oil pricing is believed by many to reflect simple supply/demand on a daily basis, WTI has become more correlated to other price trends in investment portfolios as a hedge for downside risk/upside opportunity. If 10yr rates decline for a period deemed significant enough, investors take this as a signal of economic weakness and short WTI to hedge and vice versa. The price spike in WTI in 2008 was on the belief the world was running out of oil and in 2010-2014 occurred with an economic recovery and continued belief of not enough supply. Speculators skewed prices with these fears, but inflation remained for the most part unaffected. This proved that oil prices as a basis for inflation was more myth than reality and underscored government spending as causal. Nonetheless, commodities especially oil which is consumed, cannot be recycled, requires considerable capital expenditure to produce, and remains intimately connected to economic activity without viable alternatives have always been favored as an inflation hedge once inflation pressures become apparent.
(Click on image to enlarge)
Over the past 10yrs-15yrs fossil fuels have increasingly come under activist pressures to be eliminated as primary source of CO2 and Global Warming. The data does not support this belief, yet this has received such widespread acceptance that this industry has been maligned and discarded from global endowment and pension plans leaving an industry vital for economic activity starved for investment capital with government policies geared to limit supply. This still leaves oil prices imbedded in investor psyche as the primary inflationary input as a setup for what is likely to occur the next few years.
(Click on image to enlarge)

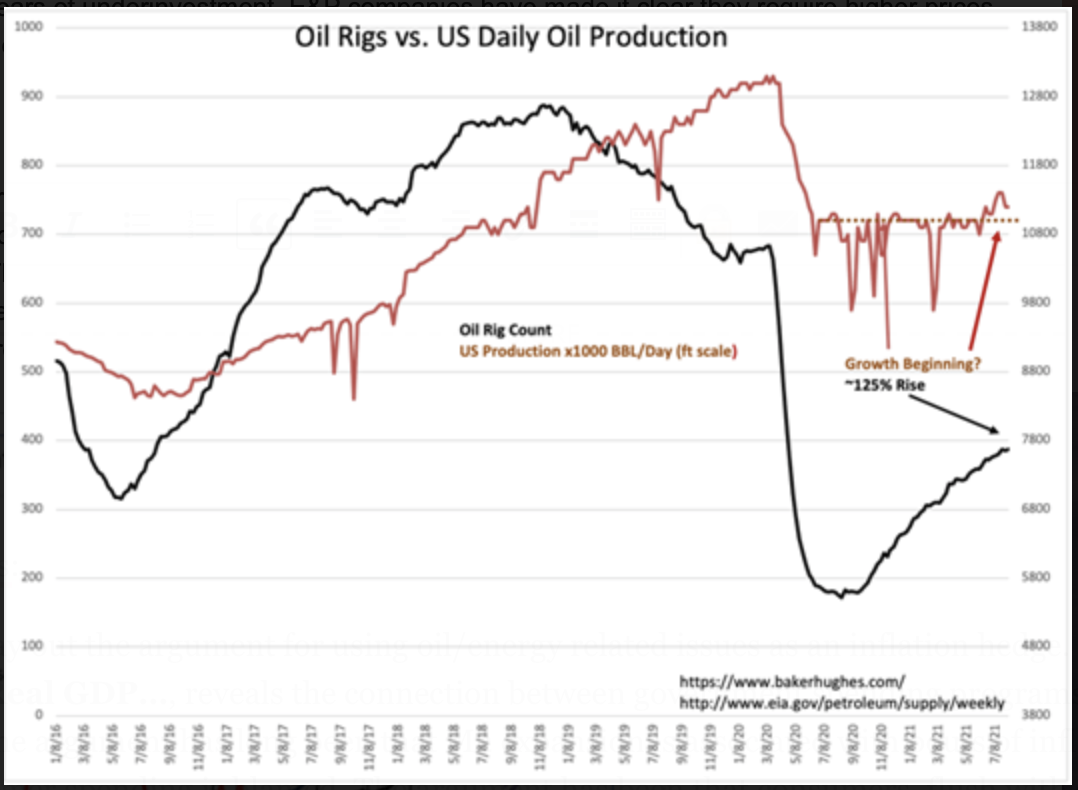
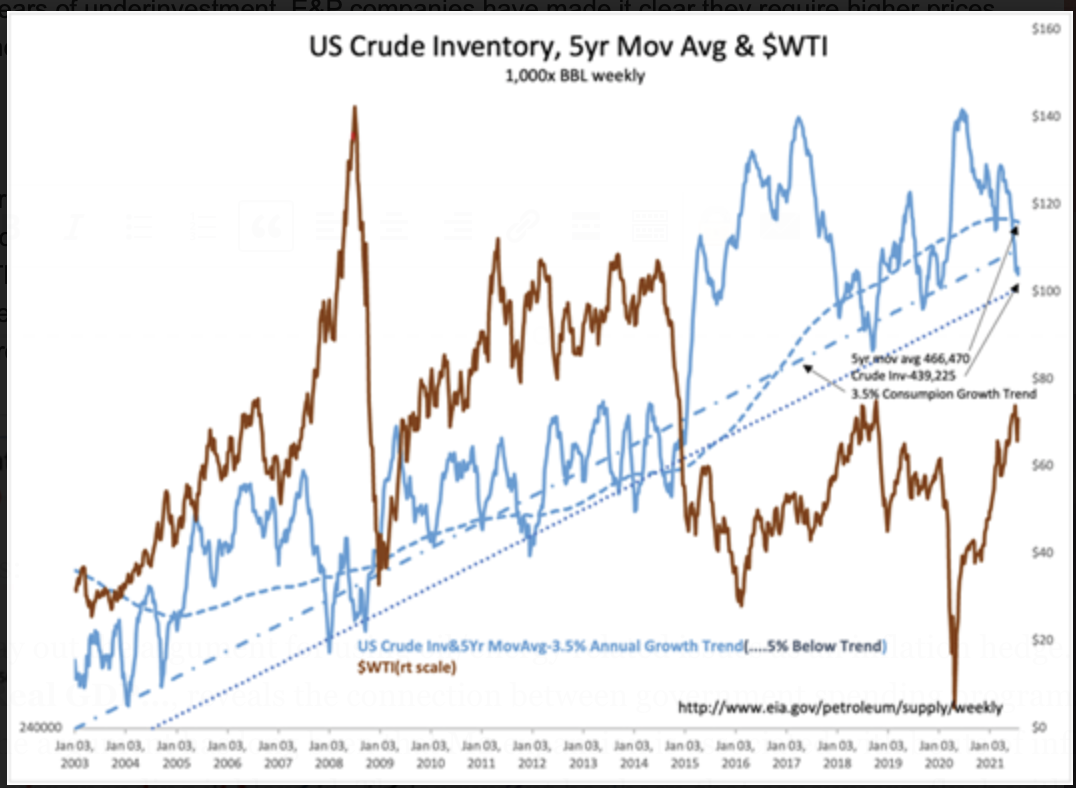
US Crude Inventory… and Oil Rigs vs US Daily Oil Production charts describe the current energy supply situation and should be viewed with the current demand situation in Energy Consumption by Fuel…The current economic trend continues towards full economic recovery post-COVID. Recent hiring trends boosting reported employment by more than 1.6mil the past 2mos are a strong indication that energy consumption will rise for all historical uses. The EIA data indicates at a minimum that fossil fuel demand is likely to rise continuing its historical 70%+ position as an energy source. US Crude Inventories have fallen towards historical low levels while the capital investments for increasing production remain tempered. This leaves the US in considerable deficit regarding expected demand with inventories falling rapidly. Even with the rig count more than doubling since the Aug 2020 low, US Production is not keeping pace with natural well production-declines as the US periodically boosts crude imports to meet demand.
(Click on image to enlarge)
In my opinion, the current disregard for oil/gas as a vital aspect for continued economic expansion is likely to change into an industry perceived as a strong investment opportunity. Some may be deluded into viewing short-term price swings as temporary. The conditions laid out here suggest a prolonged period of demand vs. undersupply. Oil/gas drilling requires specialized equipment and trained crews both of which require time to assemble. Equipment and crews have diminished supply from years of underinvestment. E&P companies have made it clear they require higher prices and lower inventories before they are willing to expand production. Inflation from excess government spending will emerge spurring a scramble to hedge portfolios to counter this risk. Oil/gas and related industries historically has been the chosen approach.
(Click on image to enlarge)
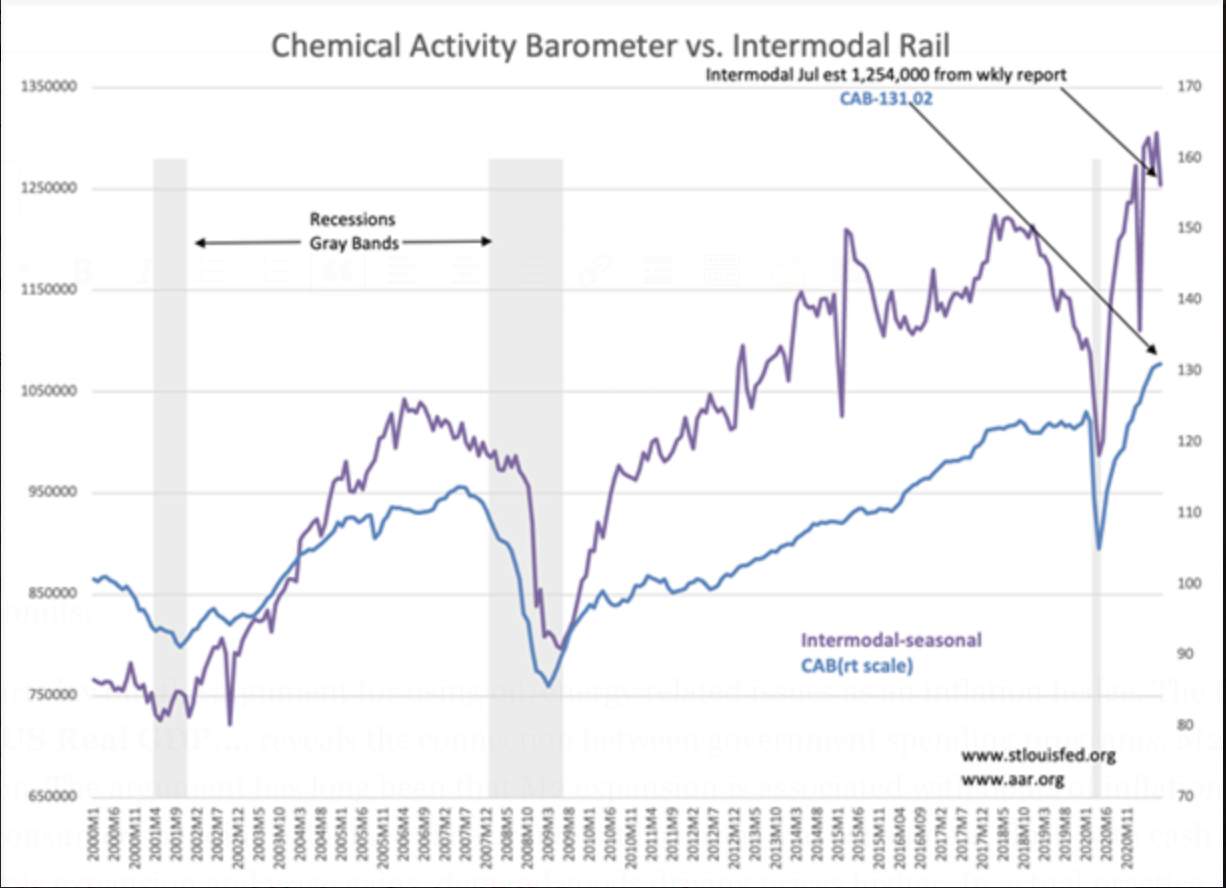
An interesting aspect to the current economic perception is that many stress that the need for additional stimulus is required for recovery. The National Bureau of Economic Analysis(NBER), to no fanfare, just declared the COVID Recession ended April 2020. The Chemical Activity Barometer vs. Intermodal Rail identified this turn long ago. These indicators have been the basis for a positive investment stance since. The recovery continues at a decent pace. In my opinion, the current environment makes E&P companies very attractive for the next few years.
(Click on image to enlarge)
Disclaimer: The information in this blog post represents my own opinions and does not contain a recommendation for any particular security or investment. I or my affiliates may hold positions or ...
more

