
Oil Prices Remain Bullish But Now Heading Into A Congestion Phase On The Monthly Chart
The price of oil has continued to rise over the last few sessions as I suggested it would in my post of last week. At the time it was trading at $52.38 per barrel and has since risen to $57.47 per barrel at the time of writing, but for a longer term perspective for the commodity, I have moved to the monthly chart which lays out the path ahead more clearly.
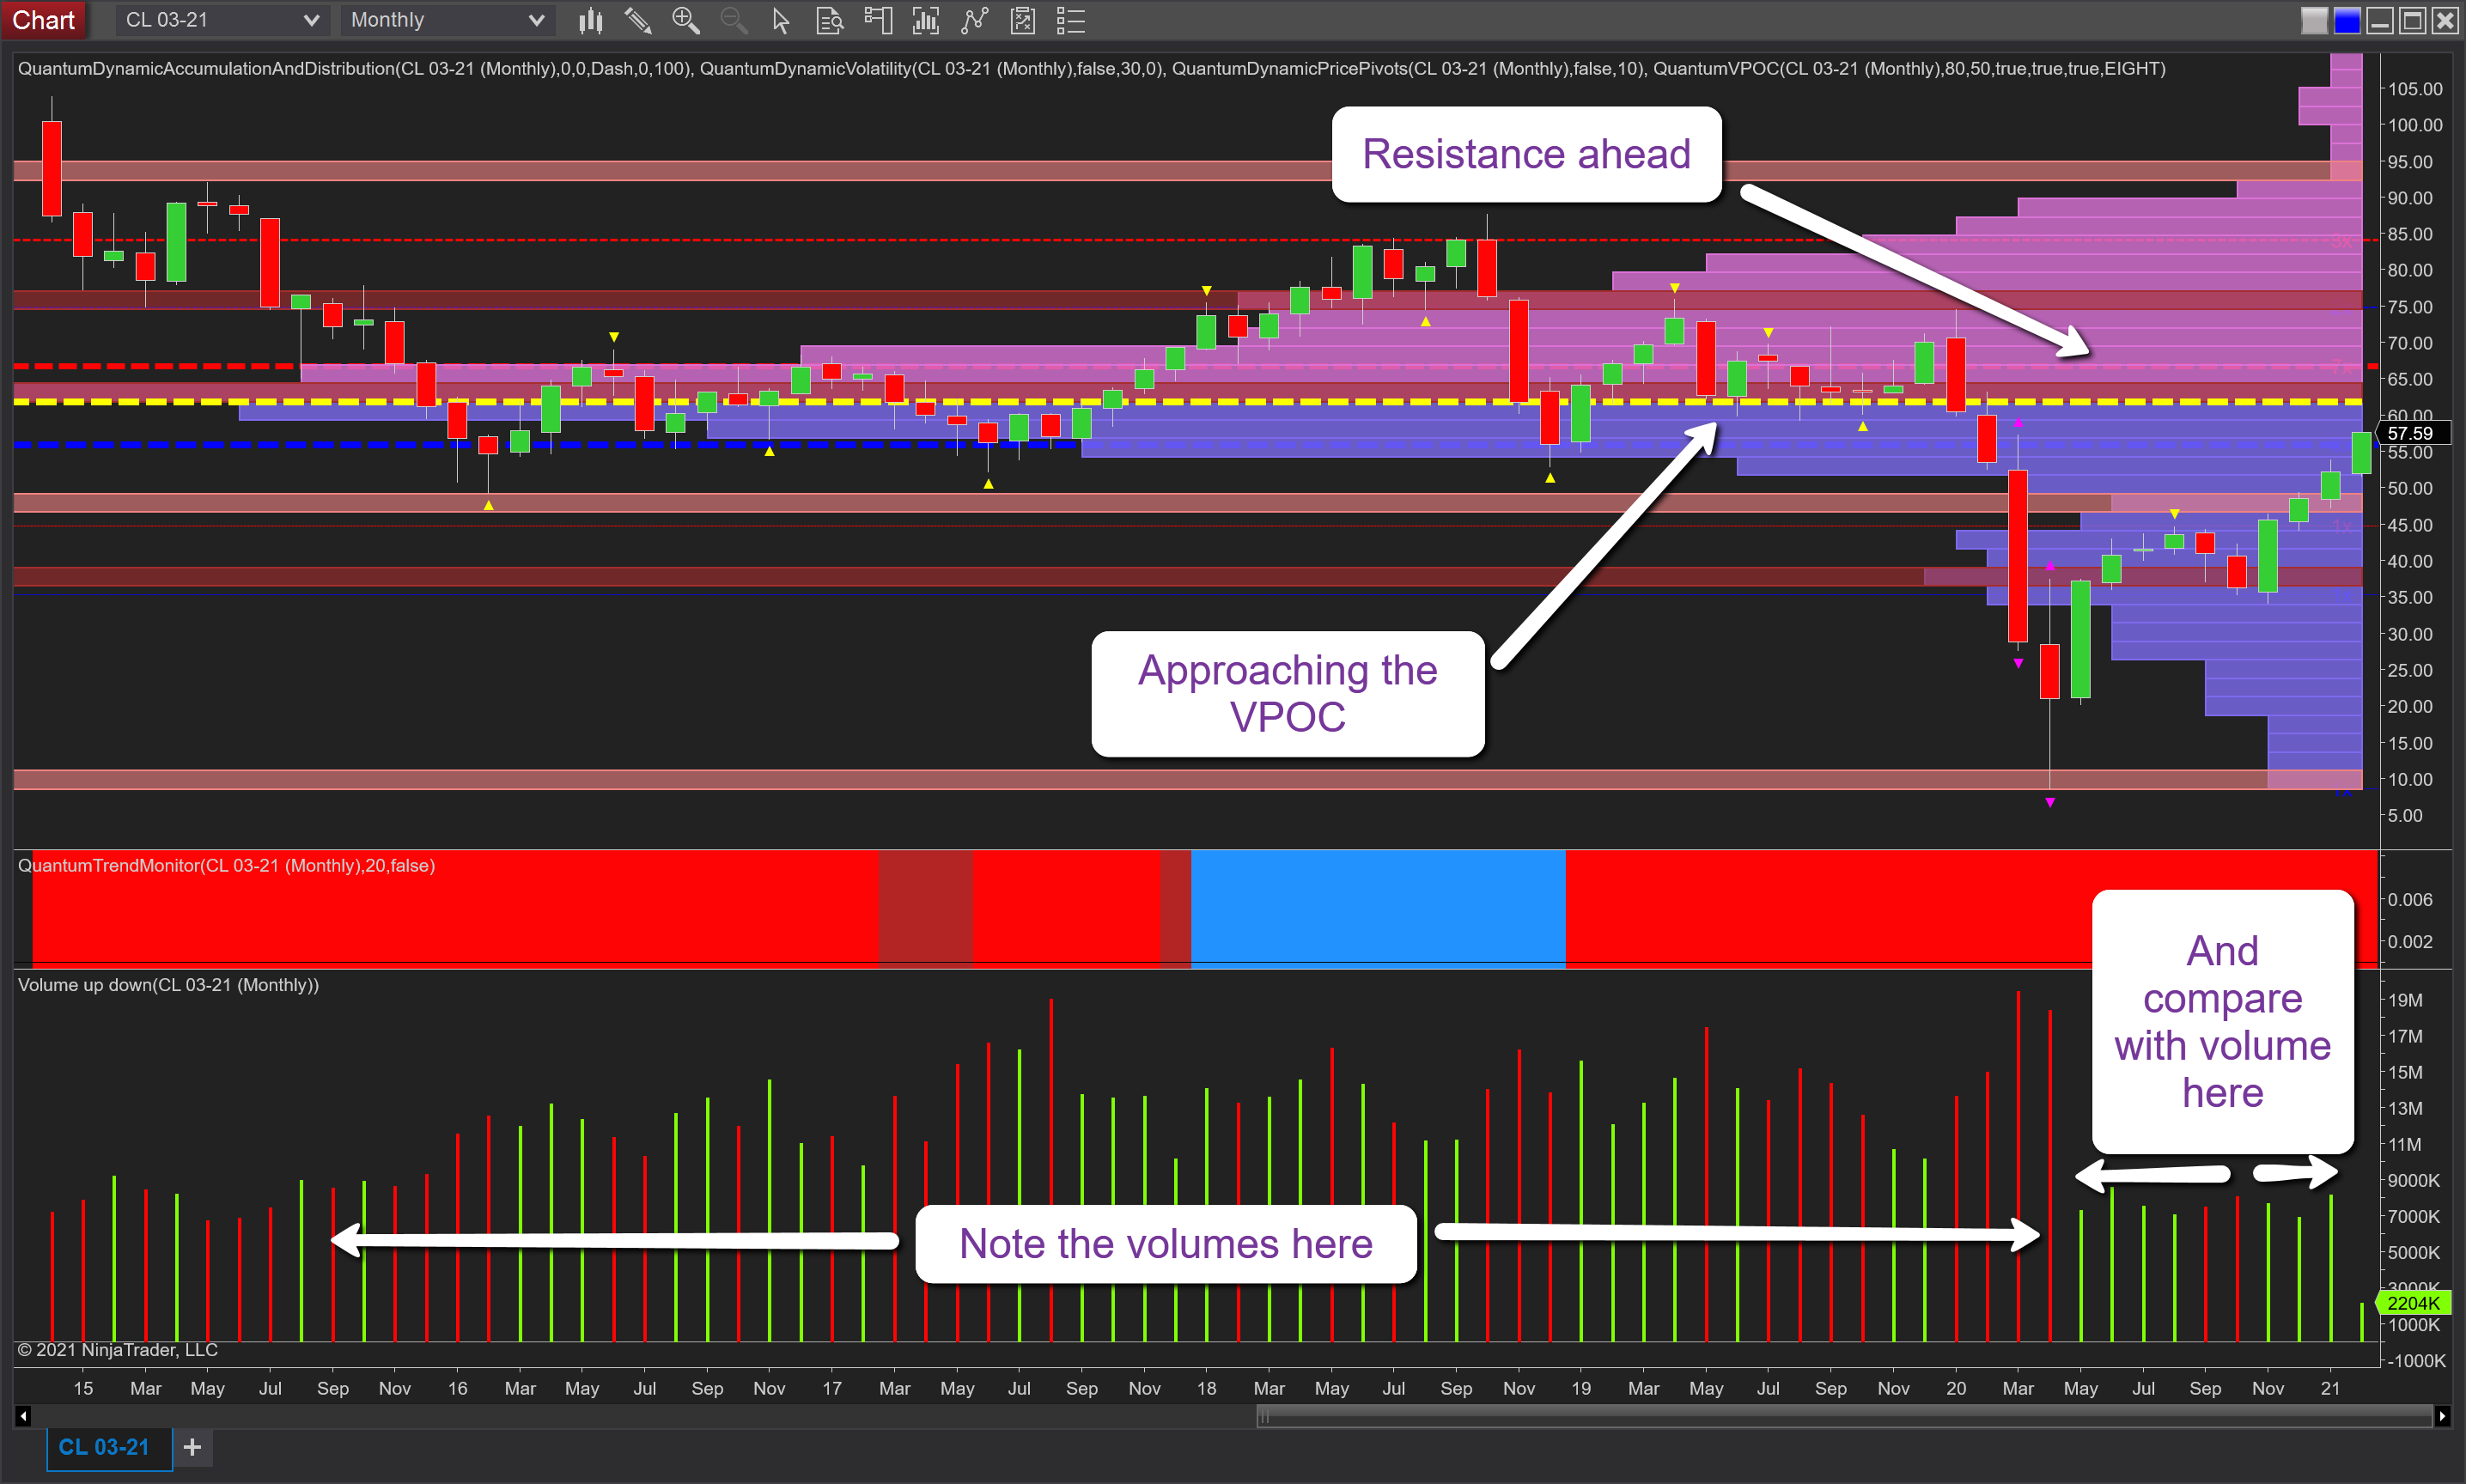
The first point to note on this chart is that we have the volume point of control now immediately ahead and denoted with the yellow dashed line at $62 per barrel. This is a key level and one where we can expect to see congestion build as prices hit the heaviest area of volume overtime on the chart. The likelihood of congestion is further confirmed with the well-developed area of price based resistance denoted with the red dashed line immediately above at $66 per barrel. These levels are created for us by the accumulation and distribution indicator which presents each level according to the number of times it has been tested and held. In other words, we have a visual picture of the strength of each level. So in this area, we have two strong reasons to expect the price to move sideways and to remain here for some time, one based on price, the other on volume, and between them likely to exert heavy pressure on the current bullish trend now underway.
Indeed as we can see, the volume on the y axis histogram extends up to $80 per barrel and with a further well-developed price-based resistance waiting at $85 per barrel, there are only two things likely to drive the price to this area. One is volume, the other is demand and the monthly chart gives an excellent perspective on the former if we look to the left of the chart and at the volume associated with the price action through 2016 to 2019. In other words, what we are witnessing at present is a rally based on modest volume, and if this rally is to be sustained and push through the heavy congestion now ahead, we will need to see a return to the volume levels last seen between 2016 and 2019 for oil to achieve anywhere near $85 per barrel in the long term.
(Click on image to enlarge)
Disclaimer: Futures, stocks, and spot currency trading have large potential rewards, but also large potential risk. You must be aware of the risks and be willing to accept them in order to invest in ...
more

