
Oil Price Volatility Hints At Emerging Markets Fallout Risk
Oil prices are officially back in a bear market with crude oil dropping 21% since the commodity topped out near $66 per barrel on April 23. Crude continues to be exposed to the downside, however, with oil price pressures revolving around the perils of intensifying US-China trade war friction and the adverse impact on global GDP growth. Moreover, President Trump’s use of tariffs as a negotiating tactic to broker more favorable trade deals – most recently with Mexico – has added another layer of uncertainty that could further destabilize global trade policy and economic growth, which remains a threat to risk assets.
CRUDE OIL PRICE (INVERTED) VS CHINESE YUAN – CHART 1
(Click on image to enlarge)
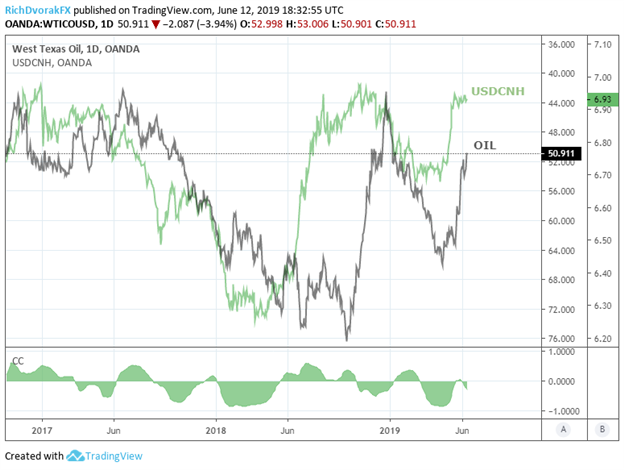
Hopes that China and the US will sort out their differences on trade and strike a deal appear to have vanished, which is reflected by spot USDCNH flirting with the taboo 7.0000 exchange rate. Owing to China’s deteriorating fundamentals, the sharp decline in the Yuan has been mirrored by a steep drop in oil prices (as illustrated above in chart 1). This comes as little surprise considering the Asian economy is the largest contributor to global GDP growth and comprises roughly 15 percent of total oil consumption. As such, oil could experience additional downside while the forthcoming side effects from an enduring US-China trade spat that drags corporate earnings, consumer spending, business investment and global GDP lower.
EMERGING MARKETS VOLATILITY VS CRUDE OIL PRICE (INVERTED) – CHART 2
(Click on image to enlarge)
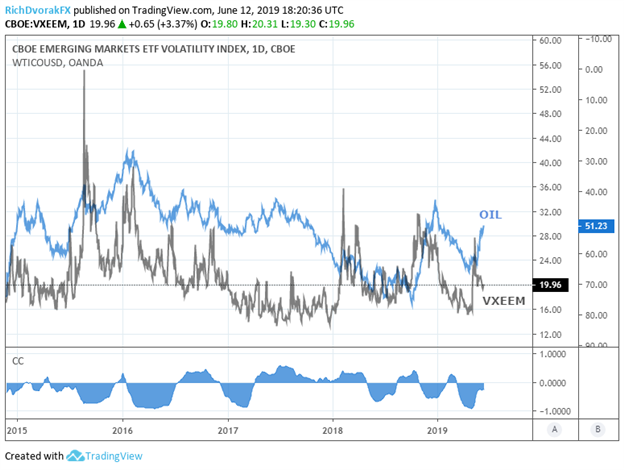
Also, there is a noticeable relationship between oil prices and emerging market volatility – measured by the Cboe Emerging Markets ETF Volatility Index (VXEEM). The association between the two assets can be broadly explained by the heightened sensitivity emerging markets and oil have to global trade activity. In turn, emerging markets face contagion risk from economic weakness in China and developed markets like the US and Eurozone. Consequently, volatility in EM equities looks possible if slowing GDP growth and lower demand for crude weighs negatively on oil prices further.
CRUDE OIL VOLATILITY VS EMERGING MARKETS (INVERTED) – CHART 3
(Click on image to enlarge)
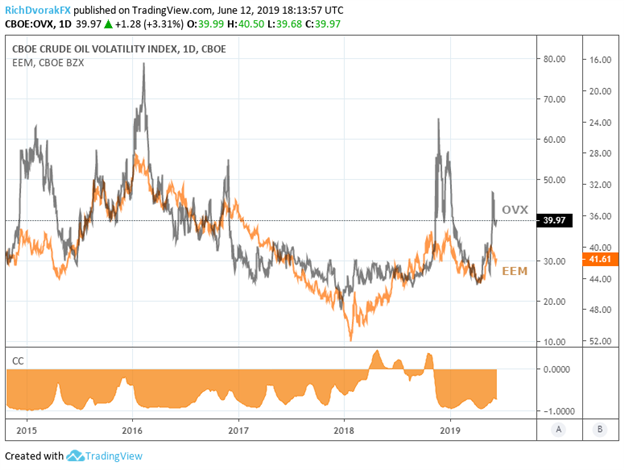
Similarly, the price of oil is inversely related to oil volatility judging by the Cboe Crude Oil Volatility Index (OVX) which generally has a strong negative correlation to emerging markets stocks gauged by the iShares MSCI Emerging Markets ETF (EEM) and is shown in chart 3. If sentiment remains damaged from slowing GDP growth fears while oil prices continue to tumble, oil volatility could spike and spook emerging markets investors. This would likely cause selling pressure in across the EM stock market which may be exacerbated by emerging markets volatility moving higher in response to lower oil prices (illustrated in chart 2).
While the risk of EM fallout appears elevated due to collapsing oil prices, downside in crude could be limited if OPEC agrees to extend – or possibly accelerate – production cuts. The move would aim to counter the adverse impact on oil demand from slowing global growth, looking to restore supply and demand imbalances.


