
Oil Price Susceptible To Large Pullback As RSI Divergence Persists
The price of oil appears to be facing a near-term correction after taking out the 2019 high ($66.60), and crude may continue to give back the advance following the OPEC Joint Ministerial Monitoring Committee (JMMC) meeting as US crude inventories widen for the third consecutive week.
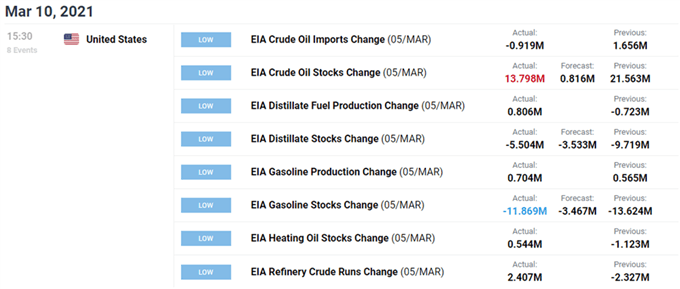
US stockpiles increased 13.798M in the week ending March 5 versus forecasts for a 0.816M rise, with the data print largely reinforcing the fresh forecast in OPEC’s most recent Monthly Oil Market Report (MOMR) as the group warns that “extended lockdowns and the re-introduction of partial lockdowns in a number of countries has resulted in downward revisions to 1H21 projections.”
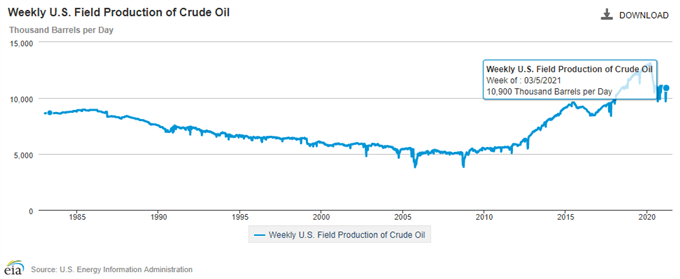
At the same time, the updated figures from the Energy Information Administration (EIA) showed the US crude production largely recovering from the weather-related disruptions from earlier this year as weekly output increased to 10,900K from 10,000K in the week ending February 26, and it remains to be seen if OPEC and its allies will regulate the energy market throughout 2021 as Saudi Arabia stays on track to reduce supply by 1 million b/d until April.
In turn, the price of oil may face headwinds ahead of the next OPEC JMMC meeting starting on March 31 as the Relative Strength Index (RSI) continues to diverge with price and still tracks the downward trend carried over from the previous month, but the broader outlook remains constructive as crude continues to track the ascending channel established in November.
With that said, the decline from the monthly high ($67.98) may turn out to be an exhaustion in the broader trend rather than a change in market behavior as US output still holds around its lowest level since 2018, and the price of oil may continue to exhibit a bullish trend as OPEC and its allies appear to be in no rush to restore crude production.
OIL PRICE DAILY CHART
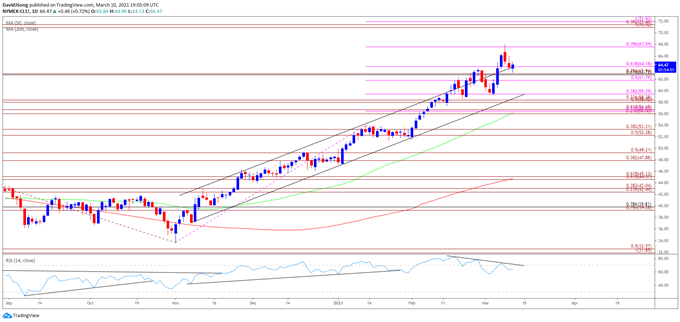
Source: Trading View
- Keep in mind, crude broke out of the range bound price action from the third quarter of 2020 following the failed attempt to close below the Fibonacci overlap around $34.80 (61.8% expansion) to $35.90 (50% retracement), with the price of oil taking out the 2019 high ($66.60) as both the 50-Day SMA ($56.20) and 200-Day SMA($44.76) still reflect a positive slope.
- The price of oil may continue to track the ascending channel established in November as it trades to a fresh yearly high ($67.98) in March, but recent developments in the Relative Strength Index (RSI) warns of a near-term correction as the oscillator continues to diverge with price to retain the downward trend carried over from the previous month.
- A break/close below the Fibonacci overlap around $62.70 (61.8% retracement) to $62.90 (78.6% expansion) brigs the $61.80 (50% expansion) region back on the radar, with the next area of interest coming in around $59.40 (38.2% expansion), which largely lines up with trendline support.
Disclosure: See the full disclosure for DailyFX here.


