
Oil Price Rebound Emerges As OPEC Keeps Crude Production Steady
The recent pullback in the price of oil appears to drive by Hurricane Ida amid the disruption in the US Gulf of Mexico, but the developments coming out of the 20thOPEC and non-OPEC Ministerial Meeting may act as a backstop for crude as the group stays on track to boost “overall production by 0.4 mb/d for the month of October 2021.”
The decision suggests OPEC and its allies will regulate production throughout the remainder of the year even as the Biden Administration argues that “OPEC+ must do more to support the recovery,” and the decline from the July high ($76.98) may turn out to be a correction in the broader trend as the most recent Monthly Oil Market Report (MOMR) emphasizes that “total world oil demand is projected to surpass the 100 mb/d threshold in 2H22 and reach 99.9 mb/d on average for the whole of 2022.”
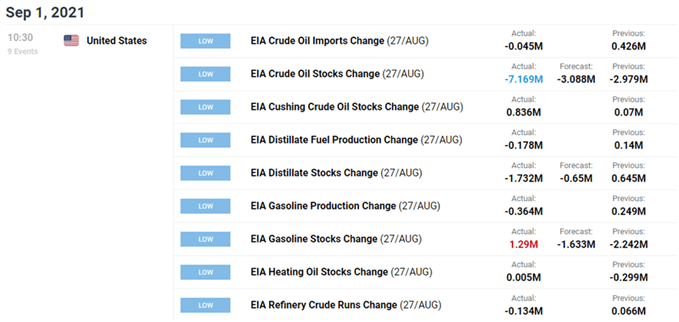
In turn, the price of oil may stage a larger recovery ahead of the next OPEC and non-OPEC Ministerial Meeting on 4 October as US inventories contract for the fourth consecutive week, with stockpiles narrowing 7.169M in the week ending August 27 versus forecasts for a 3.088M decline.
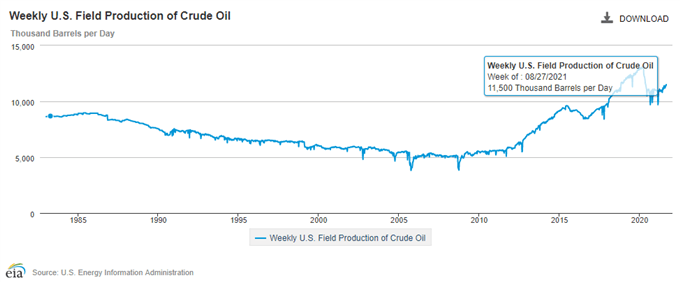
However, a deeper look at the fresh figures from the Energy Information Administration (EIA) shows an uptick in US output, with weekly field production of crude climbing to 11,500K during the same period after holding steady at 11,400K for two weeks.
With that said, a further recovery in US output may drag on the price of oil as OPEC and its allies gradually restore production, but the decline from the July high ($76.98) may turn out to be a correction in the broader trend as crude reveres ahead of the May low ($61.56).
OIL PRICE DAILY CHART
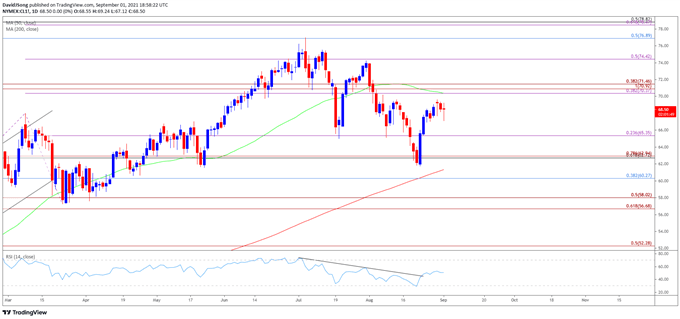
Source: Trading View
- Keep in mind, the price of oil took out the 2019 high ($66.60) as both the 50-Day SMA ($70.35) and 200-Day SMA ($61.31) established a positive slope, and the broader outlook for crude remains constructive as the rally from earlier this year removed the threat of a double-top formation.
- However, lack of momentum to test the 2018 high ($76.90) pushed the price of below the 50-Day SMA ($70.35), ), with the Relative Strength Index (RSI) forming a downward trend after flashing a textbook sell signal in July.
- Nevertheless, the decline from the July high ($76.98) may turn out to be a correction in the broader trend as the price of oil reveres ahead of the May low ($61.56), with the move above the $65.40 (23.6% expansion) region bringing the Fibonacci overlap around $70.40 (38.2% expansion) to $71.50 (38.2% expansion) on the radar, which lines up with the 50-Day SMA ($70.35).
- A break above the August high ($73.95) may generate another run at the $74.40 (50% expansion) region, with the next area of interest coming in around $76.90 (50% retracement), which largely lines up with the July high ($76.98).
Disclosure: See the full disclosure for DailyFX here.


