
Oil Price Re-Tests $60 As Yen-Strength Steps Back; EUR/USD Tests Range
FLARE OF RISK AVERSION TAKES A STEP BACK
Last week saw risk aversion show after the FOMC rate decision on Wednesday, and that theme remained fairly visible into the Friday close. The US yield curve inverted on Friday, with the three-month Treasury Bill yielding greater than that of the 10-year Treasury note; and this was the first time that’s happened since 2007. As many can remember, 2008 turned out to be a pretty painful year. But, that pain did not start directly after inversion, highlighting the inadequacy of using this observation as a timing variable. Historically, that’s somewhat of the case with yield curve inversion – it generally highlights pain ahead because of the distortion that’s seen in the observation itself – with short-term paper carrying a higher-yield than longer-dated instruments; but that does not mean that a sell-off or major turn is immediately ahead. It does highlight, however, that market participants should be on guard.
For the yield curve to invert, investors would hold a greater demand for longer-dated Treasuries, indicating a reticence to invest that same capital in riskier, potentially higher-yielding assets. This denotes rich valuations across stocks to go along with attractive yields in shorter-dated fixed-income instruments; coupled with fear that prices may pullback, making those riskier, potentially higher-yielding investments as less attractive.
On Friday, the currency market started to show swings of risk aversion with the Japanese Yen gaining in value. The low-inflation, negative rate backdrop in Japan has made the Yen a carry trade favorite for investors to sell against higher-yielding currencies. This has built-in a generally sanguine backdrop in Yen-pairs during times of ‘risk on’ market themes, similar to what was seen in January and February as markets were recovering from the Q4 slump. But, as risk aversion began to show last week around the FOMC rate decision, USDJPY began to break-lower, indicating Yen-strength, and that move continued as USDJPY pushed down to a fresh monthly low ahead of the close.
USDJPY EIGHT-HOUR PRICE CHART
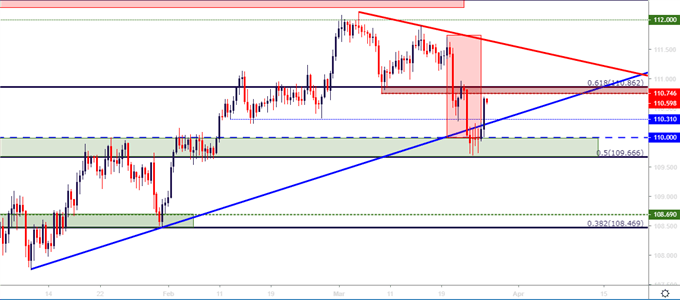
Chart prepared by James Stanley
Prices in USDJPY opened this week at a key area of support that runs from 109.67-110.00; and this was an area that helped the building bullish trend establish support in early-February. Prices returned on Friday, held through the weekend, and began to bounce around this week’s open.
But the big question at this point is whether sellers return to show resistance at prior support; allowing for the continued build of down-trend price action ahead of the Q2 open.
USDJPY TWO HOUR PRICE CHART
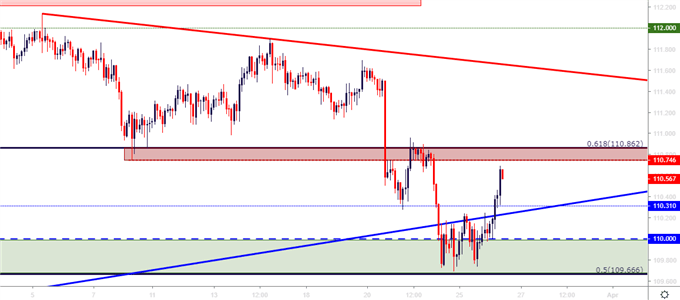
Chart prepared by James Stanley
CRUDE OIL PRICE RE-SCALES $60
Oil price have re-claimed ground above the psychological level of $60, and this comes despite a bearish formation printing on the daily chart on Friday. I had looked at this theme in the Weekly Technical Forecast in Oil, eschewing the short-term formation in favor of the longer-term trend. But, now that prices have moved back above this key point on the chart, the big question is whether buyers can hold the line or whether another pullback might be around-the-corner.
CRUDE OIL (WTI) FOUR-HOUR PRICE CHART
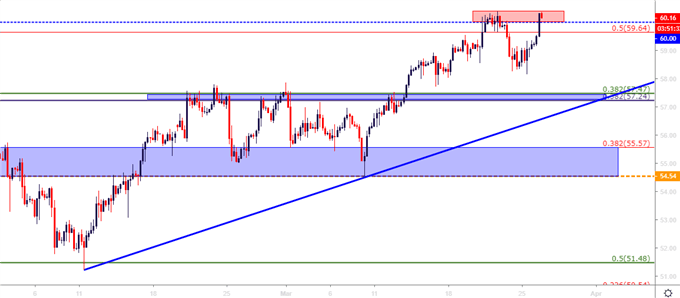
Chart prepared by James Stanley
EURUSD CATCHES HIGHS AT SHORT-TERM RESISTANCE: TRENDS AHEAD?
It’s been a fairly boring Q1 in EURUSD as the pair has remained in a range-bound state, similar to the way the pair traded for the bulk of Q2. This back-and-forth price action even held through an earlier-month announcement from the ECB that the bank would be triggering a fresh round of stimulus. Prices in the pair put in a brief flicker of weakness below range support; but buyers returned less than 24 hours later and continued to push in mid-March trade until EURUSD prices re-encountered prior range resistance at 1.1448.
A strong gust of selling showed shortly after, with EURUSD making a move-lower in that range formation as risk aversion themes priced-in on Thursday and Friday. The pair closed around the 1.1300 handle that marked the topside of the longer-term range, and yesterday saw a mild bounce as prices moved up to an area of prior short-term support; at which point sellers have returned.
EURUSD DAILY PRICE CHART

Chart prepared by James Stanley
The big question here as the Q2 open nears is whether this bearish response to lower-high resistance may be opening the door for downside continuation in EURUSD.
EURUSD TWO-HOUR PRICE CHART
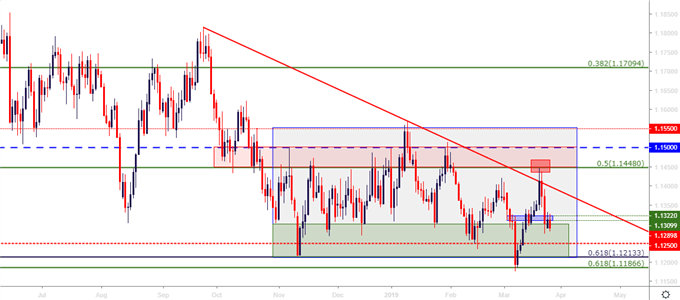
Chart prepared by James Stanley
EURJPY RE-CHECKS PRIOR SUPPORT: WILL RESISTANCE HOLD?
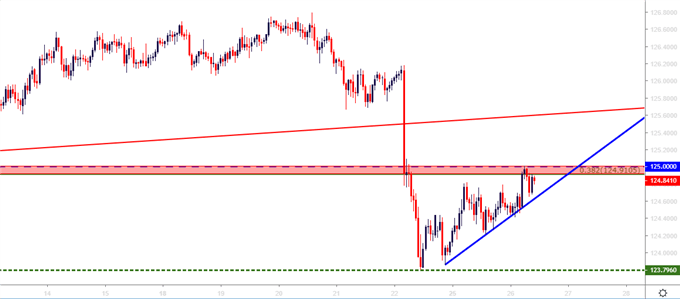
On that theme, EURJPY can remain of interest as the pair put in break-down tendencies on Friday, only to catch support at the late-January swing-low of 123.80. That support has since held, and prices have moved up for a re-test of the 125.00-area on the chart which was looked at in this week’s FX Setups of the Week. If risk aversion themes remain, EURJPY can remain of interest as the pair has tracked those themes fairly-well.
EURJPY HOURLY PRICE CHART
NZDUSD HOLDS RESISTANCE AHEAD OF RBNZ
Later today brings a rate decision out of the Reserve Bank of New Zealand, and the backdrop around the Kiwi is fairly interesting ahead of the announcement. NZDUSD is holding resistance on the topside of a symmetrical wedge pattern that’s been brewing over the past nine months, with multiple lower-highs holding the temper of the bearish trend-line atop the formation. Just above current prices is a potentially rigid area of resistance, from the .6950 and .7000 figures.
NZDUSD DAILY PRICE CHART
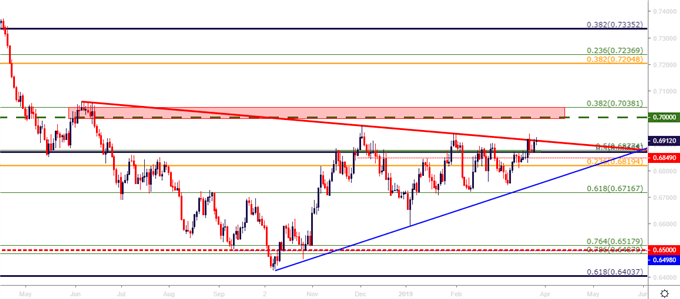
Chart prepared by James Stanley


