
Oil Price Rally Triggers Overbought RSI Signal Ahead Of OPEC Meeting
The price of oil clears the February 2020 high ($54.66) as it extends the upward trend established in November, and the OPEC Joint Ministerial Monitoring Committee (JMMC) meeting scheduled for February 3 may lead to higher oil prices as Secretary-General Mohammad Barkindo insists that the group and its allies “stand ready to take any necessary actions.”
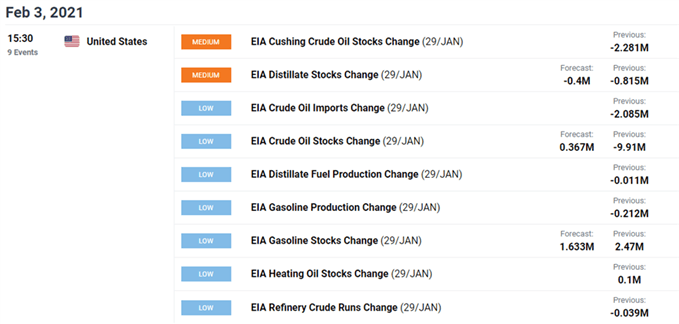
However, fresh data prints coming out of the US may drag on the price of oil as crude inventories are expected to increase 0.367M in the week ending January 29 after unexpectedly contracting 9.91M the week prior, and signs of slowing demand may encourage OPEC to regulate the energy market throughout 2021 as Saudi Arabia remains on track to reduce supply by 1 million b/d until April.
In turn, OPEC and its allies may continue to emphasize its commitment to the Declaration of Cooperation (DoC) as “the return of stricter lockdown measures and growing uncertainties have resulted in a more fragile economic recovery that is expected to carry over into 2021,” and the price of oil may continue to retrace the decline from the 2020 high ($65.65) as US production remains at its lowest level since 2018.
With that said, the technical outlook remains constructive as crude continues to trade above pre-pandemic levels, and the price of oil may continue to track the upward trend established in November even though the Relative Strength Index (RSI) fails to show a similar behavior.
OIL PRICE DAILY CHART
(Click on image to enlarge)
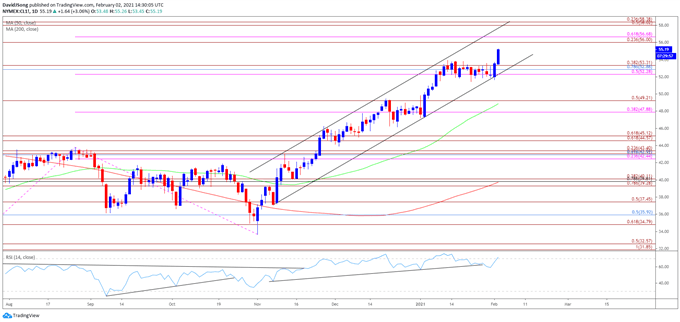
Source: Trading View
- Keep in mind, crude broke out of the range bound price action from the third quarter of 2020 following the failed attempt to close below the Fibonacci overlap around $34.80 (61.8% expansion) to $35.90 (50% retracement), and the price of oil may continue to retrace the decline from the 2020 high ($65.65) as both the 50-Day SMA ($48.86) and 200-Day SMA( $39.74) establish a track a positive slope.
- Crude has broken out of the range bound price action carried over from the end of January to extend the upward trend established in November, but the Relative Strength Index (RSI) has failed to keep up as a break of trendline support emerged ahead of February.
- Nevertheless, recent developments in the RSI offers a constructive outlook as the oscillator climbs above 70, with the push into overbought territory likely to be accompanied by higher oil prices like the behavior seen earlier this year.
- The Fibonacci overlap around $56.00 (23.6% expansion) to $56.70 (61.8% expansion) sits on the radar as the price of oil bounces back from channel support, with the next area of interest coming in around $58.00 (50% expansion) to $58.40 (23.6% expansion).
Disclosure: See the full disclosure for DailyFX here.


