
Oil Price Rally Pushes RSI Towards Overbought Territory
The breakout in the price of oil seems to be stalling amid a rebound in US production, but a move above 70 in the Relative Strength Index (RSI) is likely to be accompanied by higher crude prices like the behavior seen earlier this year.

Image Source: Pixabay
Oil Price Rally Pushes RSI Towards Overbought Territory
The broader outlook for the price of oil remains constructive even though the Organization of the Petroleum Exporting Countries (OPEC)gradually restore production as fresh data prints coming out of the US instill an improved outlook for consumption.
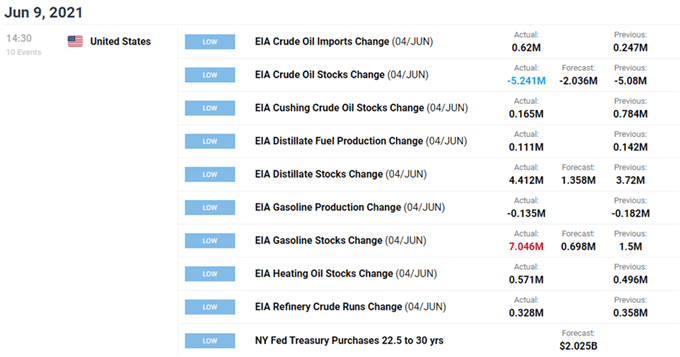
Fresh figures coming out of the Energy Information Administration (EIA) showed crude inventories falling for the third straight week, with stockpiles narrowing 5.241M in the week ending June 4 after contracting 5.08M the week prior.
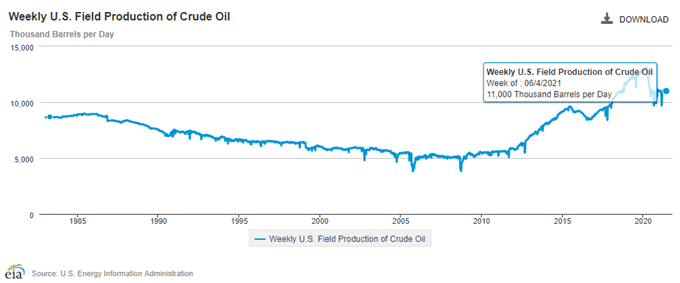
However, a deeper look at the report showed weekly field production climbing to 11,000K from 10,800K during the same period to mark the first rise since the first week of May, and a further pickup in crude output may drag on the price of oil as US production appears to be recovering from its lowest level since 2018.
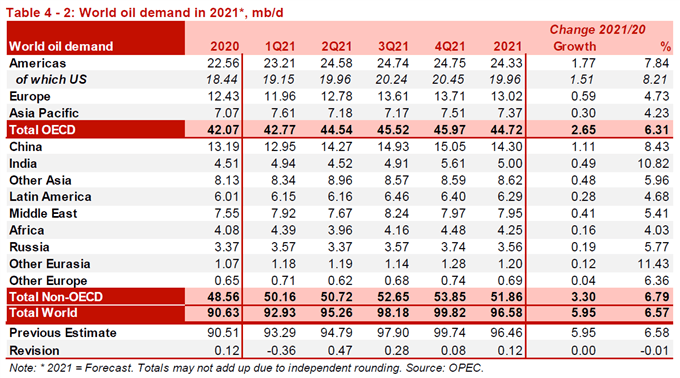
Nevertheless, OPEC’s most recent Monthly Oil Market Report (MOMR) reveals that “for 2021, world oil demand growth is kept unchanged at 6.0 mb/d,” and it remains to be seen if the group will lay out an updated production adjustment table at its next meeting on July 1 as “the recovery in global economic growth, and hence oil demand, are expected to gain momentum in 2H21.”
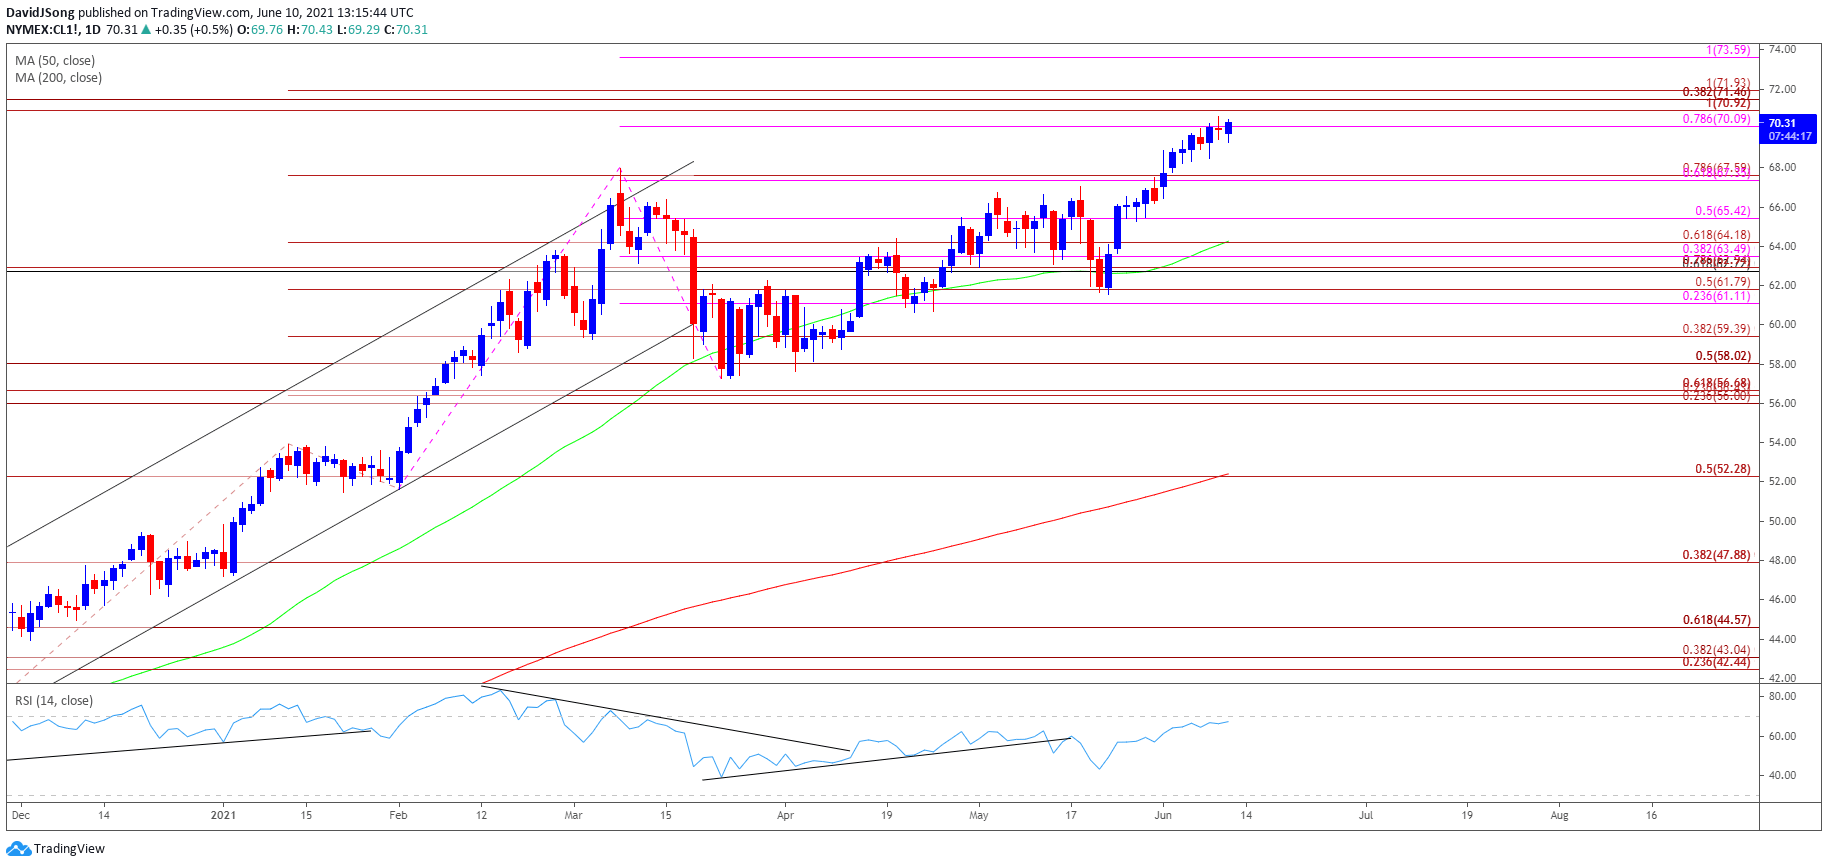
Until then, data prints coming out of the US may continue to sway the price of oil amid the ongoing contraction in energy inventories, and crude prices may continue to exhibit the bullish trend from earlier this year as the break above the March high ($67.98)negates the threat of a double top formation.
With that said, price of oil may approach the 2018 high ($76.90) as it trades to a fresh yearly high in June ($70.62), and looming developments in the Relative Strength Index (RSI) may show the bullish momentum gathering pace as the indicator approaches overbought territory.
Oil Price Daily Chart
(Click on image to enlarge)
Source: Trading View
- Keep in mind, crude broke out of the range bound price action from the third quarter of 2020 as it established an upward trending channel, with the price of oil taking out the 2019 high ($66.60) as both the 50-Day SMA ($64.26) and 200-Day SMA ($52.24)established a positive slope.
- The price of oil may continue to exhibit a bullish trend as the recent rally removes the threat of a double-top formation, with the break above the March high ($67.98) pushing crude towards the Fibonacci overlap around $70.10 (78.6% expansion) to $70.90 (100% expansion).
- Will keep a close eye on the Relative Strength Index (RSI) as it climbs towards overbought territory, with a move above 70 in the indicator likely to be accompanied by higher oil prices like the behavior seen in February.
- Need a break/close above the Fibonacci overlap around $70.10 (78.6% expansion) to $70.90 (100% expansion) to open up the $71.50 (38.2% expansion) to $71.90 (100% expansion) region, with the next area of interest coming in around $73.60 (100% expansion).
Disclosure: See the full disclosure for DailyFX here.


