
Oil Price Outlook: Crude Slips Into Support– WTI Trade Levels
Oil prices plummeted more than 2.7% into the start of the week with price rebounding off near-term uptrend support today- is relief in sight? These are the updated targets and invalidation levels that matter on the crude oil technical charts.
CRUDE OIL PRICE CHART – WTI DAILY
(Click on image to enlarge)
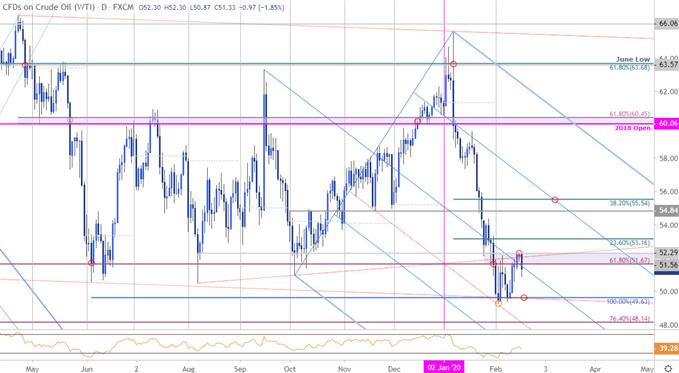
Chart Prepared by Michael Boutros, Technical Strategist; Crude Oil (WTI) on Tradingview
Technical Outlook: In my last Oil Price Outlook we noted that crude, “sell-off is taking crude towards initial near-term support targets – look for a reaction on a test of the lower parallel / 54.” WTI broke the below the figure and tested it as resistance the following week before resuming lower with the decline rebounding off the 100% extension of the decline off the 2019 highs at 49.63. The focus now falls on a break of the February opening-range for guidance with the broader short-bias at risk within this zone.
CRUDE OIL PRICE CHART – WTI 120MIN
(Click on image to enlarge)
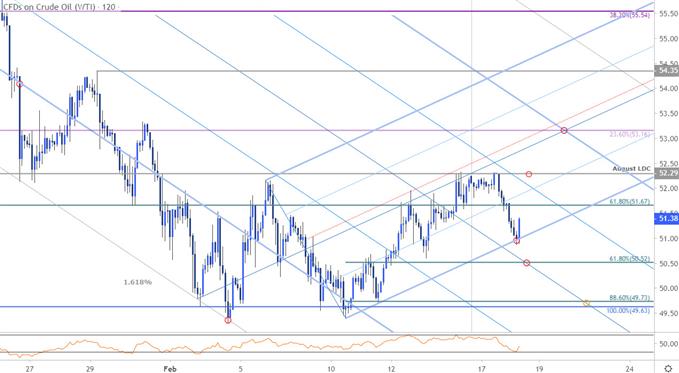
Notes: A closer look at crude oil price action shows WTI trading within the confines of a near-term ascending pitchfork formation extending off the monthly lows. An early-week pullback is defending the lower parallel today with price currently trading into the monthly open at 51.56.
Initial resistance stands at 51.67 with a breach above the August low-day close at 52.29 needed to fuel a larger breakout towards 53.16- look for a larger reaction there IF reached. A break below today’s lows would invalidate this near-term uptrend with such a scenario targeting the 61.8% retracement at 50.52 and 49.63/73.
Bottom line: The oil price sell-off is testing near-term uptrend support today and the immediate focus is on a break of the weekly opening-range for guidance. From a trading standpoint, the setup remains constructive while within this formation with a breach above 52.29 needed to mark resumption. Ultimately, a larger recovery may offer more favorable short-entries closer to broader downtrend resistance.
CRUDE OIL TRADER SENTIMENT – WTI PRICE CHART
(Click on image to enlarge)
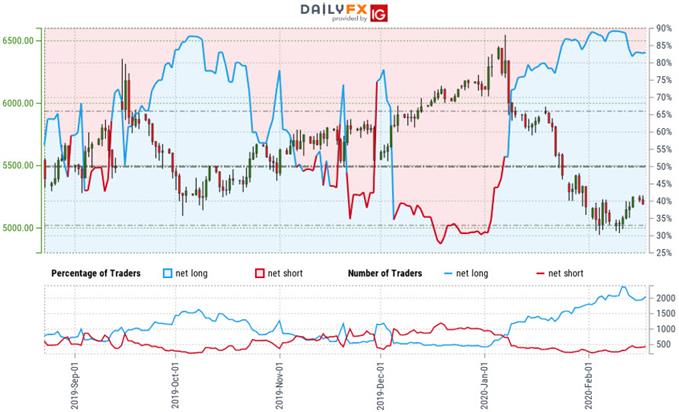
- A summary of IG Client Sentiment shows traders are net-long crude oil - the ratio stands at +4.29 (81.10% of traders are long) – bearish reading
- Long positions are 4.34% lower than yesterday and 15.54% lower from last week
- Short positions are5.36% higher than yesterday and 43.49% higher from last week
- We typically take a contrarian view to crowd sentiment, and the fact traders are net-long suggests Oil - US Crude prices may continue to fall. Yet traders are less net-long than yesterday & compared with last week and the recent changes in sentiment warn that the current Crude Oil price trend may soon reverse higher despite the fact traders remain net-long.


