
Oil Price Outlook: Crude Rips Into Resistance – WTI Trade Levels
Crude Oil prices ripped higher into the start of the December trade with WIT surging than 6%. The rally takes price into a key resistance zone that has capped oil advances for the past month and the focus is on this week’s close for guidance. These are the updated targets and invalidation levels that matter on the oil price weekly chart.
CRUDE OIL PRICE CHART – WTI WEEKLY
(Click on image to enlarge)
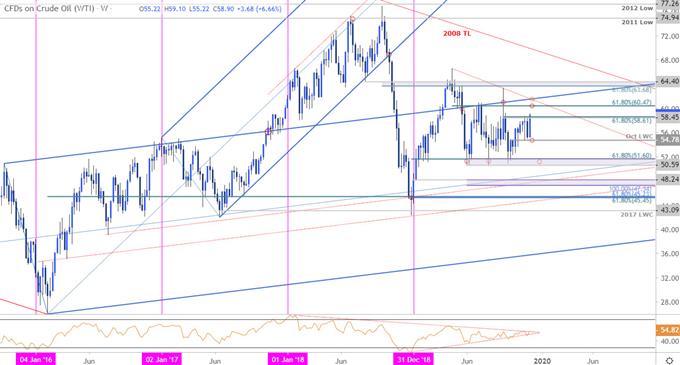
Chart Prepared by Michael Boutros, Technical Strategist; Crude Oil (WTI) on Tradingview
Notes: In my previous Oil Weekly Price Outlook we noted that WTI was, “approaching confluence downtrend resistance just higher at 58.45/61.” - region defined by the 61.8% retracement of the September decline and the September high-week close. Crude tested this zone for two weeks before plummeting more than 4.5% last week – a subsequent reversal into the December open is attempting to breach this threshold today – watch the weekly close here. Note that momentum has been contracting since the start of the year and we’re on the lookout for the breakout of this consolidation formation for guidance.
A close above this threshold would keep the focus on subsequent topside resistance objectives at the 61.8% retracement of the April decline at 60.47 and the highlighted trendline confluence around ~61.40s. Weekly support remains with the October low-week reversal close at 54.78- weakness beyond this threshold would suggest a more significant high is in place with such a scenario shifting the focus back towards critical support at 50.59-51.60- look for a larger reaction there IF reached.
Bottom line: Crude oil prices are testing confluence resistance into the start of monthly – keep your eye on the close for guidance here. From a trading standpoint, a good place to reduce long-exposure / raise protective stops – be on the lookout for possible topside exhaustion IF price marks a weekly close below this threshold. I’ll publish an updated Oil Price Outlook once we get further clarity on the near-term technical trade levels.
CRUDE OIL TRADER SENTIMENT – WTI PRICE CHART
(Click on image to enlarge)
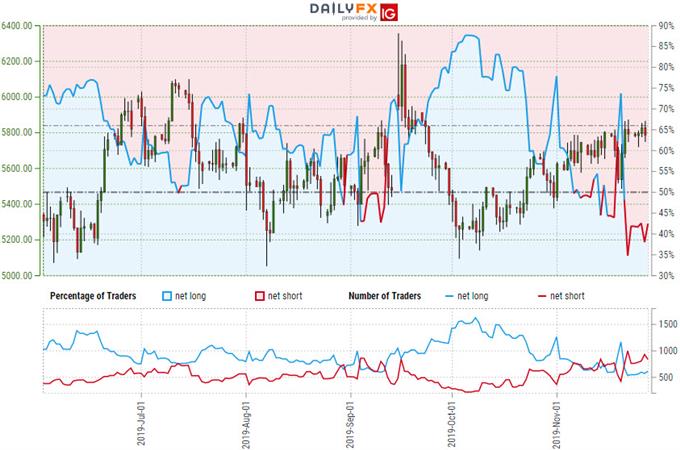
- A summary of IG Client Sentiment shows traders are net-short crude oil - the ratio stands at -1.31 (43.34% of traders are long) – weak bullish reading
- Long positions are 4.75% lower than yesterday and 2.82% lower from last week
- Short positions are6.88% lower than yesterday and 9.27% lower from last week
- We typically take a contrarian view to crowd sentiment, and the fact traders are net-short suggests Oil - US Crude prices may continue to rise. Yet traders are less net-short than yesterday and compared with last week. Recent changes in sentiment warn that the current Oil - US Crude price trend may soon reverse lower despite the fact traders remain net-short.


