
Oil Price Clears March High To Push RSI Into Overbought Territory
The price of oil trades to a fresh monthly high ($48.80) as fresh data prints coming out of the US instill an improved outlook for crude consumption, with oil inventories contracting 3.135M in the week ending December 11 versus forecasts for a 1.937M decline.
(Click on image to enlarge)
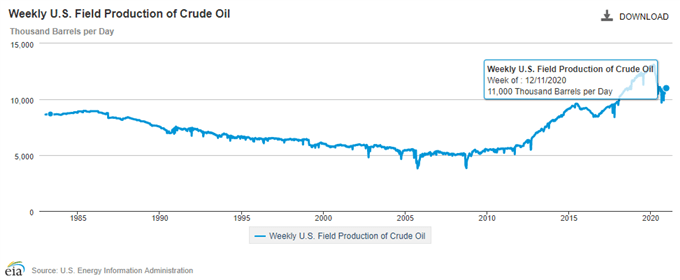
At the same time, the update for the Energy Information Energy (EIA) showed field production narrowing to 11,000K from 11,100K in the week ending December 4, and persistent signs of subdued supply may keep crude prices afloat amid the tepid recovery in US output.
At the same time, it seems as though the Organization of the Petroleum Exporting Countries (OPEC) will continue to regulate the energy market next year as the group pledges to “voluntary adjust production by 0.5 mb/d from 7.7 mb/d to 7.2 mb/d” at its last meeting for 2020, and the ongoing commitment to the Declaration of Cooperation (DoC) may continue to act as a backstop for crude as the price of oil continues to track the upward trend established in November.
With that said, the price of oil may continue to retrace the decline from the start of the year as it clears the March high ($48.66), and recent developments in the Relative Strength Index (RSI) suggest the bullish momentum will gather pace over the coming days as the indicator pushes into overbought territory for the first time since 2019.
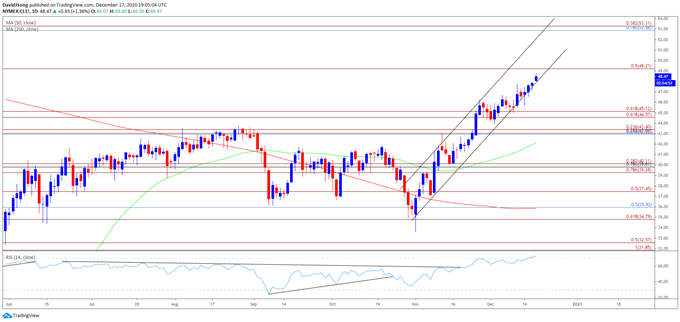
OIL PRICE DAILY CHART
(Click on image to enlarge)
Source: Trading View
- Keep in mind, crude has broken out of the range-bound price action carried over from the third quarter following the failed attempt to close below the Fibonacci overlap around $34.80 (61.8% expansion) to $35.90 (50% retracement), and the price of oil may continue to retrace the decline from the start of 2020 as it clears the March high ($48.66).
- The Relative Strength Index (RSI) highlights a similar dynamic as the oscillator breaks out of the downward trend from June to push into overbought territory for the first time since 2019, and the indicator may show the bullish momentum gathering pace as long as it holds above 70.
- The $49.20 (50% expansion) region remains on the radar as the price of oil continues to track the upward trend from November, with the next area of interest coming in around $52.90 (78.6% retracement) to $53.30 (38.2% expansion) followed by the February high ($53.66).
Disclosure: See the full disclosure for DailyFX here.


