
Oil Market Conditions And Opportunities
Oil Market Conditions and Opportunities
Oil prices are in a period of strong decline. That has hurt the prices of energy companies generally, as you see in the following chart.
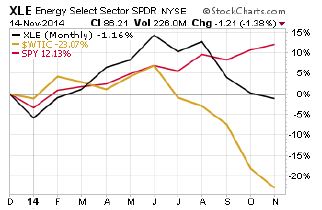
West Texas Intermediate Crude (gold line) is down about 23% YTD, and that has flattened the return on the S&P 500 Energy Sector (black line) taking about 15% off its YTD total return.
Energy has underperformed the S&P 500 since the oil price broke.
A fundamental question is whether the break in oil and the underperformance of energy is an opportunity or a good way to lose money. We tend to think it is more of an opportunity (particularly in strong dividend-paying oil stocks), because of the logic for long-term continuing global demand growth and related oil price recovery.
Short-Term Bearish Oil Price View:
The U.S. Energy Information Administration reduced its 2015 average West Texas Crude price forecast to $77.75 from $94.58. The International Energy Agency reduced its 2015 Brent forecast to $83.42 from $101.67. JP Morgan, the most bearish of investment banks, cut its 2015 forecast for Brent crude to $82 from $115. Goldman Sachs reduced its 2015 West Texas Crude forecast from $90 to $75, and its Brent Crude forecast from $100 to $85. Vladimir Putin says his country may face a "catastrophic" drop in oil price, but will weather the storm. Saudi Arabia is increasing production to maintain its revenue, instead of cutting production to support the price of oil. This behavior is symptomatic of the current problem among oil export economies.
Long-Term Bullish Oil Price View:
In spite of various movements to stop using carbon-based fuels, there is still no good substitute for liquid fuels for transportation (that means oil and gas), and no alternative to oil and gas for petrochemicals production, which will continue. World population continues to grow, and oil consumption per capita in the developing world continues to grow. Oil prices are quite volatile and prone to geo-political price premia coming and going, but most of the large price drops have recovered in a year or two.
The US Energy Information Agency base-case price projection for West Texas Crude by 2020 is $94.57 (scenarios range $66.90 to $148.28). They project Brent Crude at $96.57 by 2020 (scenarios range $68.90 to $150.28). The International Energy Agency forecasts oil prices from $130 per barrel to $116 per barrel by 2025, depending on the policy choices made by major countries.
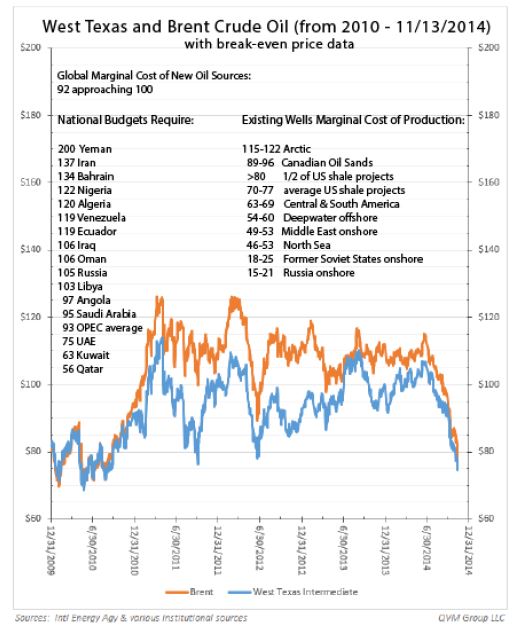
The break-even price for about ½ of the fracking being done in the US is $80 or more. The OPEC average to support their national budgets is about $93. The global break-even to find and produce new oil to replace consumed oil is about $92 per barrel.
Let’s look more at oil price and investment implications.
Long-term Oil Prices and Break-Even Price Levels:
Many existing wells can keep pumping at current and lower prices, but current prices will not pay for national budgets of key oil exporting countries such as Saudi Arabia, Iraq, Libya, Iran, Russia, and Nigeria; and will not pay for the cost of finding and replacing pumped oil on a global average basis. Current low prices are unsustainable.
Long-Term Effects:
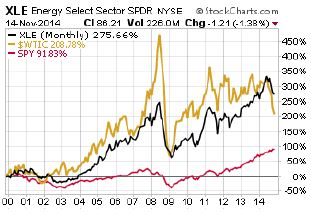
Over the past 15 years oil has had very large price swings, but net direction has been up, and long term forecasts are mostly up. Demographic upward forces on oil may outweigh climate change policies over the next 10 to 20 years. The S&P 500 Energy Sector (dominated by very large stocks) has done well versus the S&P 500 index. The sector will probably do well again, particularly due to large-cap, low debt, strong cash flow & dividend growth members.
Short-Term Investment Effects:
With low oil prices, consumers enjoy lower transportation and heating costs, and perhaps lower cost of some manufactured goods. However, it remains to be seen if lower manufacturing costs translate to lower product prices. More likely, lower manufacturing costs will increase industrial profits and stock prices (reference XLI, the S&P 500 Industrials Sector).
Small-cap, high debt oil and exploration and production companies without legacy wells, are likely to have difficulty servicing debt. That would adversely impact high yield bond funds, which tend to have 10% to 15% of their assets in the oil and gas sector.
Oil refiners and petrochemical manufacturers will benefit from lower input costs.
Oil drilling companies and related services and products (such as drilling pipes) will see a drop in revenue as oil and gas companies on balance reduce capital expenditure plans during this period of low oil prices, to keep cash flow up.
Alternative energy sources, such as wind and solar, will face downward price pressure while oil and gas prices are low.
Utility companies will have lower costs of energy input, but rate adjustments may not be immediately reflected in utility bills, and will probably be averaged over time.
Pipeline/storage MLPs shouldn’t be impacted too much because they earn by throughput, not commodity price.
Car companies selling larger, less efficient cars and trucks, may gain in market share short-term.
Russian stock market prices should be strongly negatively impacted due to high break-even costs, while Gulf States ETFs (investing in UAE, Kuwait, and Qatar) may do well due to break-even prices that still work. Venezuela could be forced to default on its debt if prices remain low, which could impact some large hedge funds and some international banks who lent them money. Canadian oil will be disproportionately negatively impacted given the high break-even cost of oil sands production, which is an important part of their reserves. And, Norway will be hurt – not usually thought of in the same conversation as OPEC, but they are highly oil dependent.
Major oil importers such as China and Japan will benefit.
Municipal bonds in some oil drilling communities may be under pressure as their economies are hit by reduced drilling activity.
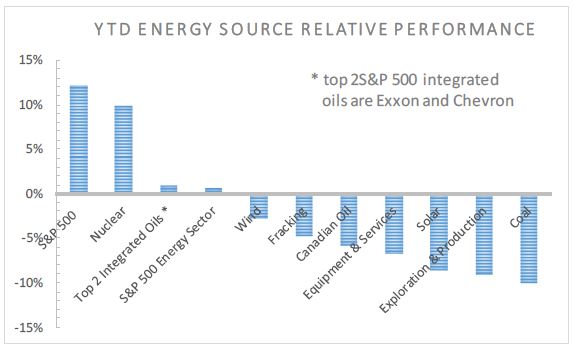
Oil & Gas Sub-Sectors:
Sub-sectors of energy have fared differently. Exploration and drilling/services have been damaged more than integrated oil and gas companies that lose on the production side, but gain on the refining and retail side.
The S&P 500 Energy Sector is dominated by the integrated oil and gas companies, so XLE has done better than subsector ETFs.
This YTD chart shows how exploration and production (XOP), and equipment and services (OIH) and fracking companies (FRAK) and Canadian oil companies (ENY), have done versus the S&P 500 Energy Sector overall (XLE).
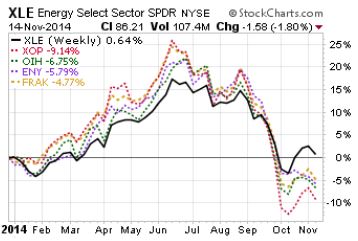
The worst performer is exploration and production (red line), because of expected reduction in drilling and therefore less new oil and gas found (less replacement of produced oil).
Alternative Energy:
Alternative energy prices are not independent of oil and gas prices, except to the extent that they receive government subsidies or that energy policies force energy source substitution. Generally, when oil and gas prices decline, alternative energy source prices also decline.
This YTD chart shows coal (KOL red), nuclear (NLR gold), wind (FAN green) and solar (TAN red) versus the S&P 500 Energy Sector (XLE black).
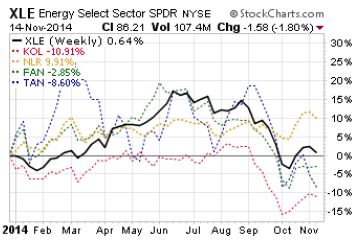
Nuclear is holding its own, but KOL, which has government energy policies working against it, is down the most.
S&P 500 Energy Sector Stocks Involved in Exploration and Production
If the price of oil is likely to recover in a year or so, what companies in the S&P 500 Energy Sector might be good investment prospects?
Here are the four stocks involved in exploration and production that passed this filter: (1) above market yields, (2) dividend increases each year for at least 10 years, including major oil sell-off in 2008, (3) low debt levels relative to equity, (4) above average financial strength ratings, (5) not seen as overvalued by Standard & Poor’s, (6) are seen as market performers or better in the year ahead by both Standard and Poor’s and Value Line, and (7) PEG ratio not over 3x [PEG is forward P/E divided by 5 year forward earning growth projection].
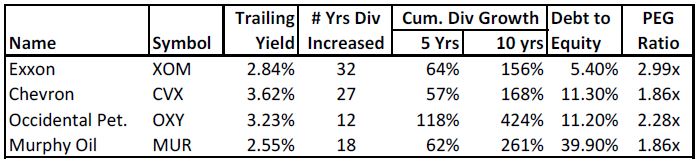
They are beat up by the current oil price situation, which may be the opportunity to own them at a discount.
The chart on the left shows how these four stock have underperformed the S&P 500 (black) so far this year, and have moved in sympathy with the price of oil (gold). The chart on the right shows how these stock have performed well versus the S&P 500 over a 10-year period.
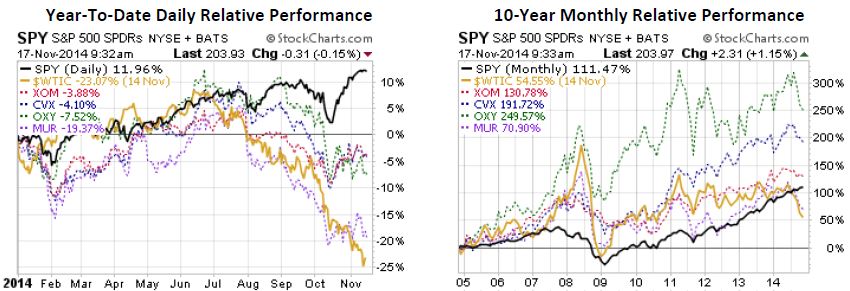
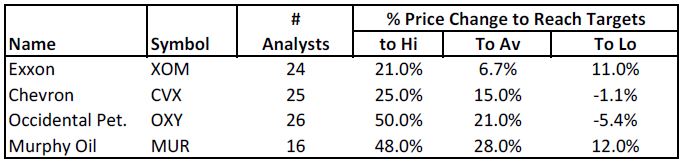
Here are the “Street” estimates for year-ahead price change for these four companies:
This information was originally sent to subscribers on Nov. 14, 2014.
Disclosure: None.
"QVM Invest”, “QVM Research” are service marks of QVM Group LLC. QVM Group LLC ...
more

