
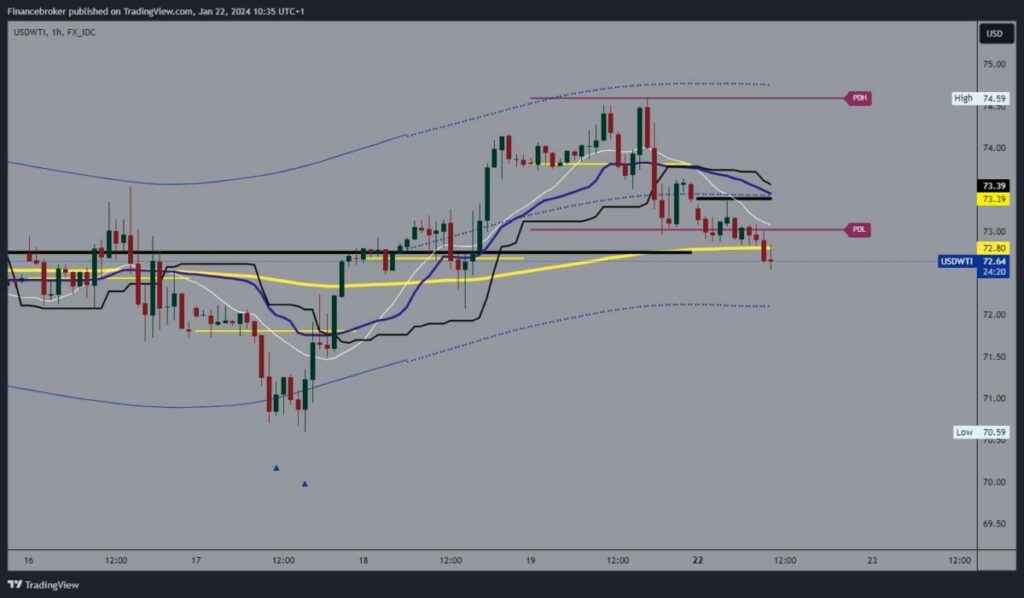
Oil chart analysis
Oil price retreated after rising to $74.59 on Friday. In two attempts on Friday, we had the opportunity to jump over that level, but we failed to move above it, and a retreat followed. We quickly returned below $74.00, and Friday closed at $73.39.
During the Asian session, the pullback continued, and the price fell below the $73.00 level. In the EU session, we saw a continuation and breakout below the EMA200 moving average, with the formation of this week’s low at the $72.60 level.
Potential lower targets are $72.50 and $72.00 levels. We need a positive consolidation and stabilization above the EMA200 and the $73.00 level for a bullish option. If we succeed in this, we are in a good position to continue on the bullish side. Potential higher targets are the $73.50 and $74.00 levels.
(Click on image to enlarge)
Natural gas chart analysis
At the market opening last night, the gas price made a bearish gap from $2.52 to the $2.36 level. After that, we are looking at a bullish consolidation and recovery to the $2.41 level. We expect to see further recovery in natural gas prices by the end of the day if this consolidation continues. On the bearish side, potential lower targets are $2.35 and $2.30.
For a bullish option, we need to reach the $2.50 level. Thus, we would erase almost the entire loss from the Asian session. The price would form a bottom from which it could continue in further recovery. Potential higher targets are $2.60 and $2.65 levels. The EMA200 moving average is up in the zone around the $2.75 level.
(Click on image to enlarge)

More By This Author:
EURUSD And GBPUSD: EURUSD Faces Resistance At 1.09100Oil And Natural Gas: Oil Is Recovering Above $74.00 Level
Bitcoin and Ethereum: Bitcoin under pressure falls to $40600


Comments
Log in or sign up to join the conversation.