
New Profitable Call On Natural Gas: The Yoyo-Trade Is Back
Gas prices surged in stride and then the market plunged back down like a yoyo thrown from a balcony. What caused such a reaction?
At the beginning of the week, Henry Hub natural gas futures closed above the $4 psychological mark on the NYMEX for the first time this new year as a result of robust US LNG exports and weather-driven demand. Overall, the prices on the February contract were still trading on a longer-term downtrend, which is why I was especially looking for the best spot to initiate a short-selling trade rather than jumping on a galloping horse.
Photo by American Public Power Association on Unsplash
Meanwhile, some of our subscribers – always free to scalp the market (or to take more aggressive counter-trend trades towards our suggested entries) – were just getting ready to go short around the $4.876.5.079 resistance zone (highlighted by a yellow band), with a stop placed just above the higher $5.400 level (represented by a red dotted line) and targets at $4.568 and $4.213 (also marked by two green dotted lines), according to my last projections.
As a result, gas prices indeed surged in stride (performing a high-speed rally up to the 4.879 that got almost immediately stopped by the yellow band – thus triggering our entry). It was just before the market plunged back down like a yoyo thrown from the third floor and wheeling on the first-floor balcony, considering our targets to be located on both the second and first floors.
This sudden reversal move was certainly triggered on the one hand, technically by aggressive traders taking profits, but also, more fundamentally, by a slowdown in gas demand as the purchases for colder weeks were already anticipated by the commercials (large MNCs hedging their risk, oil and gas majors, utility companies, etc.); the latter having undoubtedly more impact and weight than we, or larger speculators, on those markets. Thus, I would say the key is trying to think like them to get some understanding of trading energies.
Trading Charts
(Click on image to enlarge)
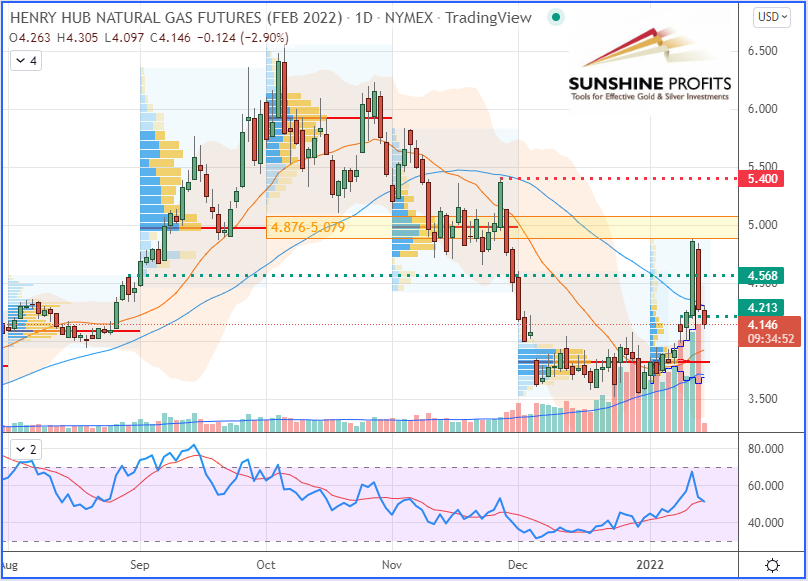
Chart – Henry Hub Natural Gas (NGG22) Futures (February contract, daily chart)
Now, let’s zoom into the 4H chart to observe the recent price action all around the above-mentioned levels of our trade plan:
(Click on image to enlarge)
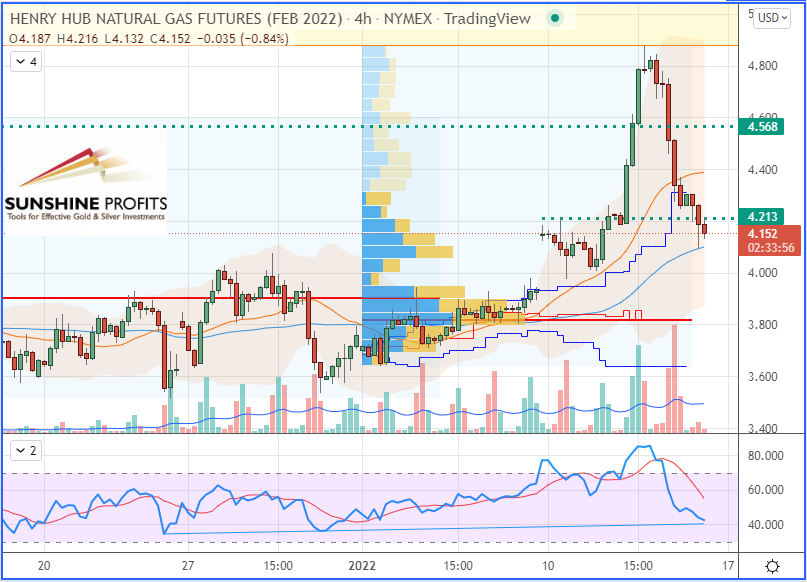
Chart – Henry Hub Natural Gas (NGG22) Futures (February contract, 4H chart)
In summary, my trading approach has led me to suggest some short trades around potential key resistances since this sudden surge in natural gas offered a great opportunity for the bears to enter short whilst aiming towards specific projected targets. Some of you – more aggressive traders – may also enjoy jumping on galloping horses. However, for such trades, the timeframe would be much shorter and difficult to make everyone take advantage of them, due to the volatility in the markets and the fact that I always try to provide trades with optimal entry levels meeting a profitable risk-to-reward ratio.
You are always free – at your own risk and time schedule – to scalp the markets in a more aggressive way (counter-trend trading) towards a projected entry area if you feel comfortable doing so. However, sometimes, the “FOMO” (Fear-Of-Missing-Out) voices might tell you to trade when you shouldn’t, so just be aware that over-trading could also lead you to take more risky positions – refraining from trading all the time is also part of trading – a mind game that you will have to rapidly master!
Disclaimer: All essays, research and information found in this article represent the analyses and opinions of Sunshine Profits' associates only. As such, it may prove wrong and be ...
more

