Natural Gas Weekly Forecast, Sept. 21 - 25
Forecast for the Upcoming Week
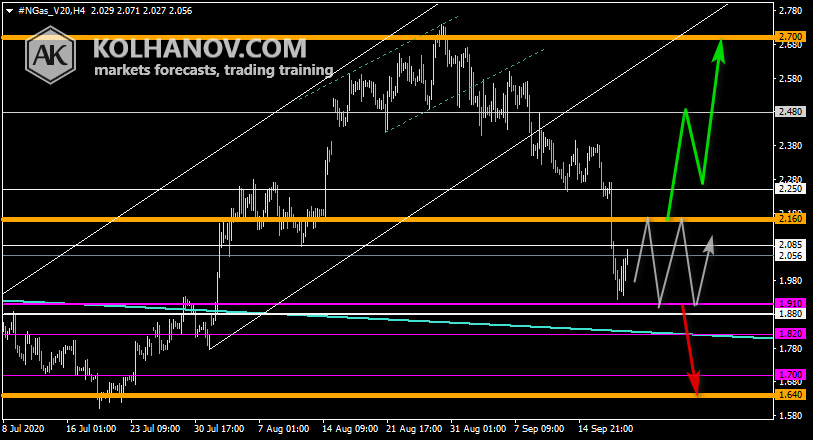
- Uptrend scenario: An uptrend will start as soon as the market rises above resistance level 2.160, which will be followed by moving up to resistance level 2.480 and 2.700.
- Downtrend scenario: The downtrend may be expected to continue in case the market drops below support level 1.910, which will be followed by reaching support level 1.640.

Natural gas forecast chart for the previous week

Fundamental Analysis
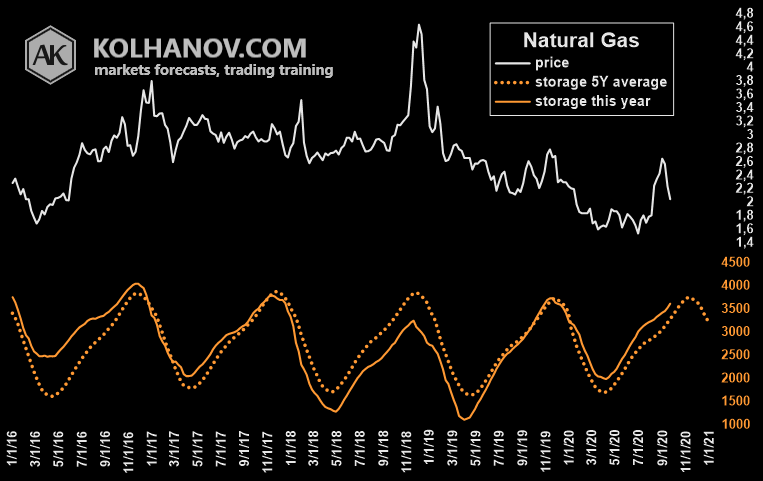
The difference between supply and demand presents an oversold market and price at the $2.7 level. Before November, demand is temporarily embraced, which pushed the price down. Yet after the first few cold weeks, the market will go up back to the target level of $2.7.

Long-Term Forecast (Quarter III: July - September, 2020)
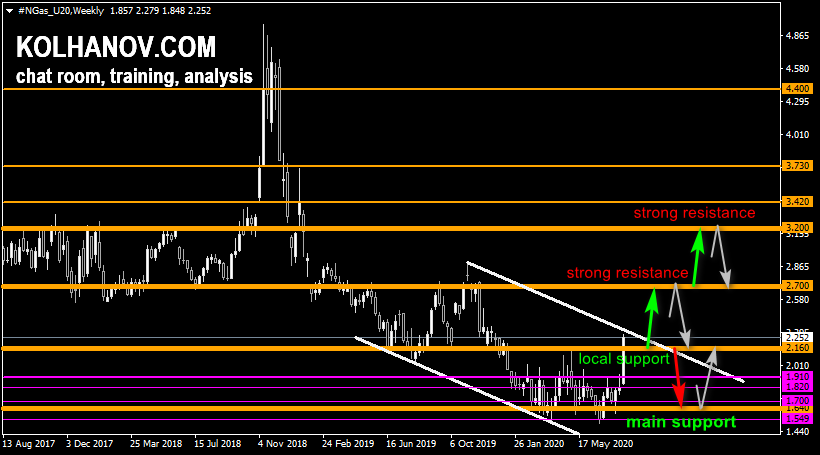
- Uptrend scenario: The uptrend may be expected to continue while the market is trading above the support level 2.160, which will be followed by reaching resistance level 2.700.
- Downtrend scenario: A downtrend will start as soon as the market drops below support level 2.160, which will be followed by moving down to support level 1.640.

Disclaimer: All information provided by Anton Kolhanov is for informational purposes only. Information provided is not meant as investment advice nor is it a recommendation to Buy or Sell securities. ...
moreComments
Please wait...
Comment posted successfully.
No Thumbs up yet!


