
Natural Gas Looks Clearly Bearish Based On Elliott Wave Theory
Today we will talk about Natural gas, its price action from a technical point of view, and wave structure from the Elliott Wave perspective.
We have been bearish on Natgas all the time and seems like the downtrend is not finished yet.

Photo by American Public Power Association on Unsplash
After a big, higher degree a-b-c corrective movement at the end of 2020, ideally for wave B, Natgas turned down in an impulsive fashion, probably as part of the first leg (i) of a new five-wave cycle within wave C that can push the price back to 2020 lows.
Well, after we noticed a nice bearish setup formation with waves (i) and (ii), seems like Natural gas is on the way down within wave "iii" and after the recent break below the strong daily channel support line, it's actually confirming the bearish trend.
Natural Gas, Daily
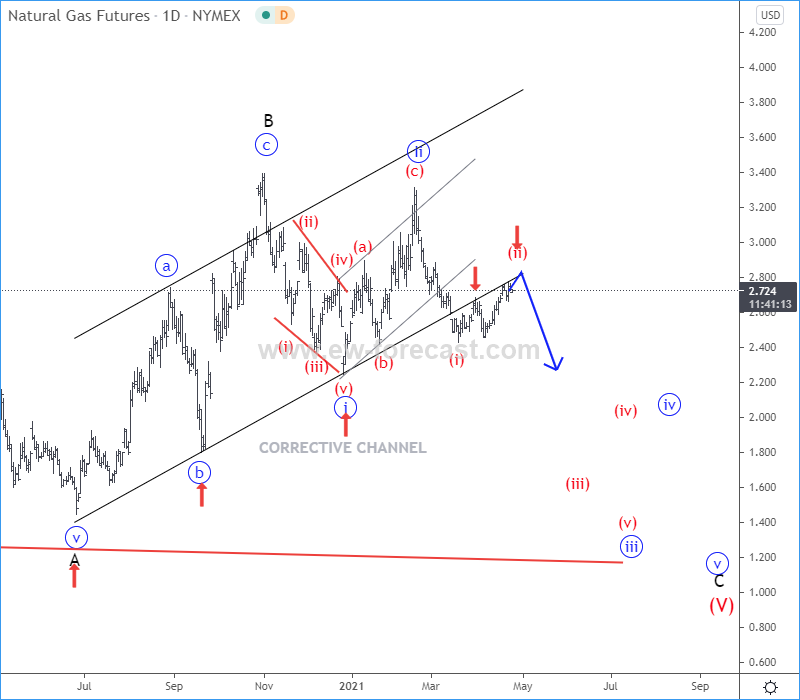
Currently, we can see another three-wave intraday corrective pullback, ideally in subwave (ii), where the support line of a corrective channel may now act as a strong resistance.
All that being said, be aware of a bearish continuation in 2021, ideally and probably as part of a new five-wave cycle within wave C of a higher degree wave (V) that can send it back to 2020 lows to complete a bigger weekly ending diagonal pattern.
Disclosure: Please be informed that information we provide is NOT a trading recommendation or investment advice. All of our work is for educational purposes only.


