
Natgas Production Growth Potential Has Been Severely Damaged
SUMMARY
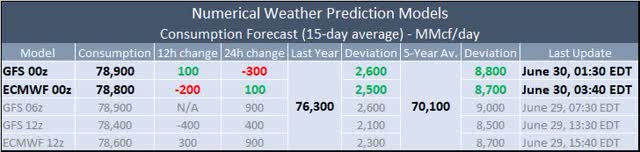
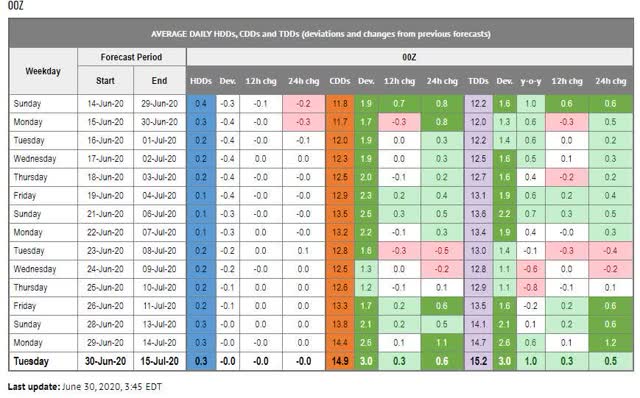
- Consumption-wise, ECMWF 00z Ensemble is bearish vs yesterday's 12z results. In absolute terms, ECMWF model is mostly in line with the latest GFS model.
- Projected TDDs are trending higher and remain above the norm (+20.5%) as well as above last year's level (+7.4%). Consumption is projected to increase by 4.5% over the next seven days.
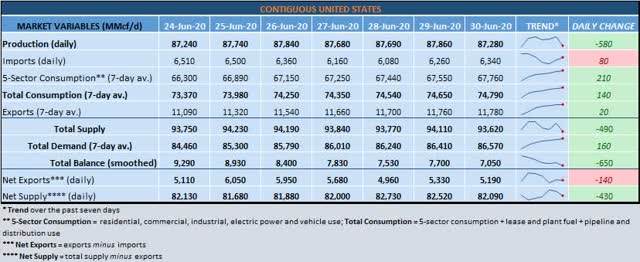
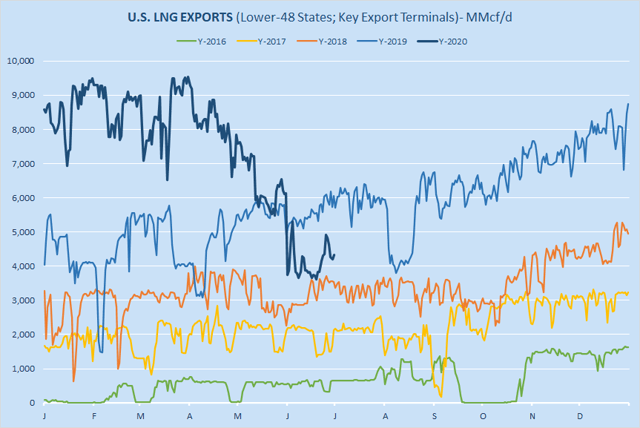
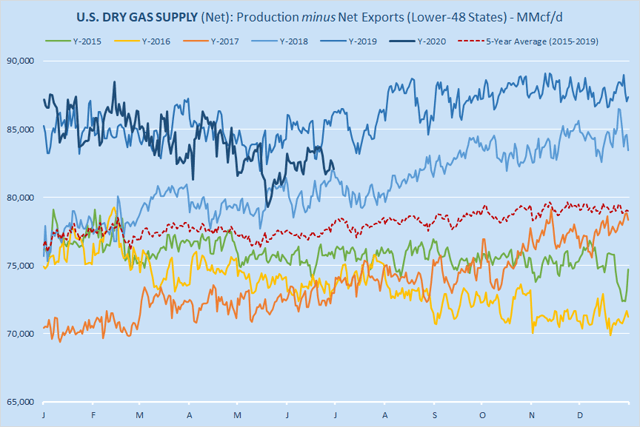
- So far, LNG feedgas flows are holding above 4.0 bcf/d; Production has been trending lower over the past ten days (slowly). It is currently estimated at 87.3 bcf/d.
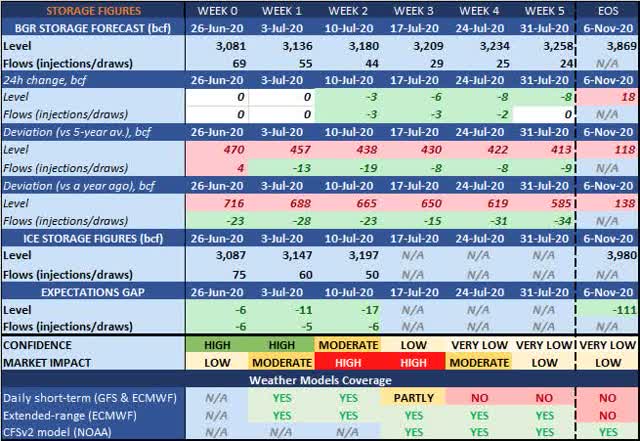
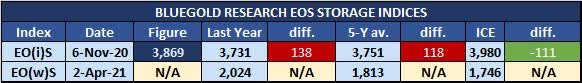
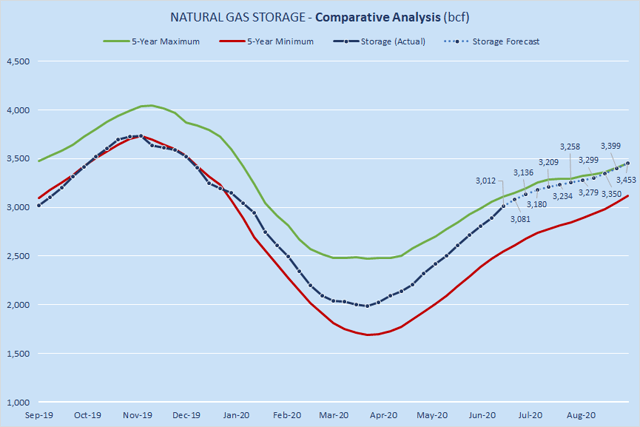
- Our storage level outlook was revised lower (vs Monday's results), but mostly in the mid-term. Currently, EOS storage index is at 3,869 bcf (111 bcf below market expectations).
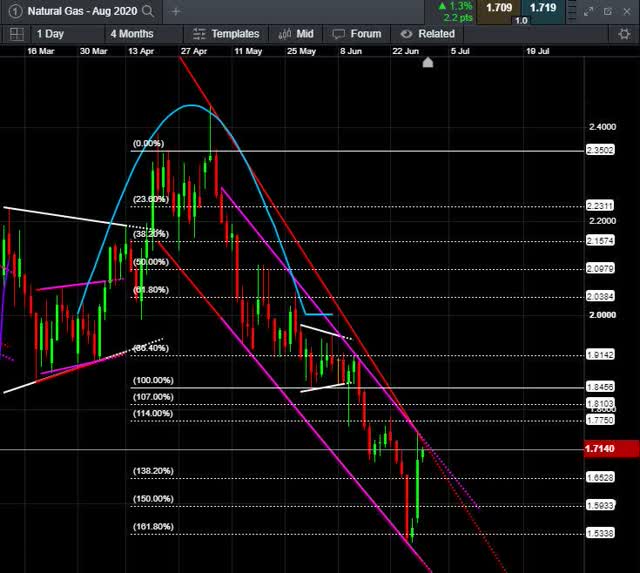
- In the short-term, the bulls are in control. A break above 1.720 could lead to a gain into the 1.750-1.790 range. A break below 1.670, could cause a fall into the 1.640-1.590 range. In the long-term, however, natgas is still trading within the descending channel.
TRADING VIEW
Exposure
- We currently have no active positions in progress;
- We are planning to re-enter the market in July or August.
- The bears have lost control (at least, in the short-term).
- As long as natgas (Aug. contract) is trading above 1.673-1.670, the trading bias will remain bullish.
- Today’s fundamental signals are neutral-to-bullish.
- A break above 1.720 could lead to a gain into the 1.750-1.790 range.
- A break below 1.670, could cause a fall into the 1.640-1.590 range.
- It makes sense to buy the dips - particularly near 1.650 and especially in the 1.630-1.600 area.
Bullish factors
- Projected TDDs are trending higher and remain above the norm (+20.5%) as well as above last year's level (+7.4%).
- Natgas consumption (7-day average) is projected to increase by 4.5% over the next 7 days (from 74.8 bcf/d today to 78.1 bcf/d on July 7).
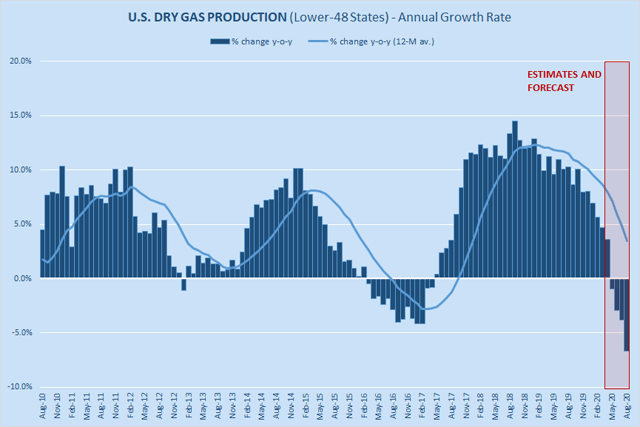
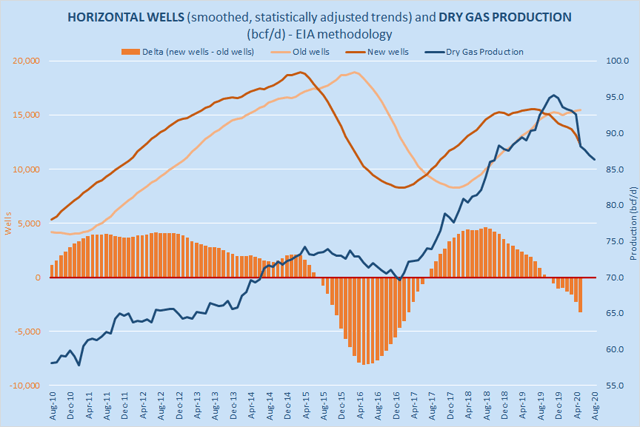
- Natgas production growth potential has been severely damaged. Daily production rate is not expected to set a new all-time high for several years. EIA expects dry gas production to continue falling until March 2021. CAPEX remains depressed.
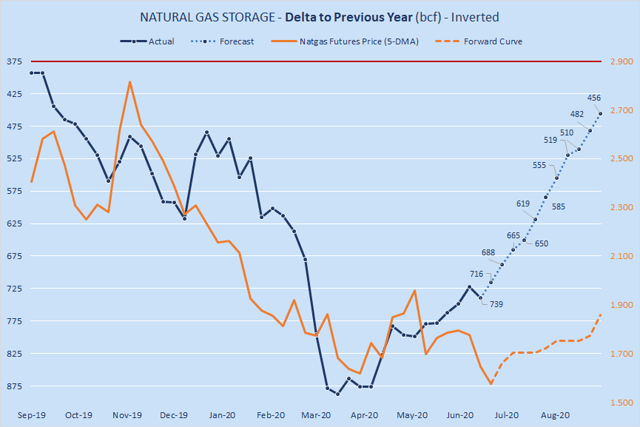
- Annual storage "surplus" is projected to shrink by -131 bcf by July 31.
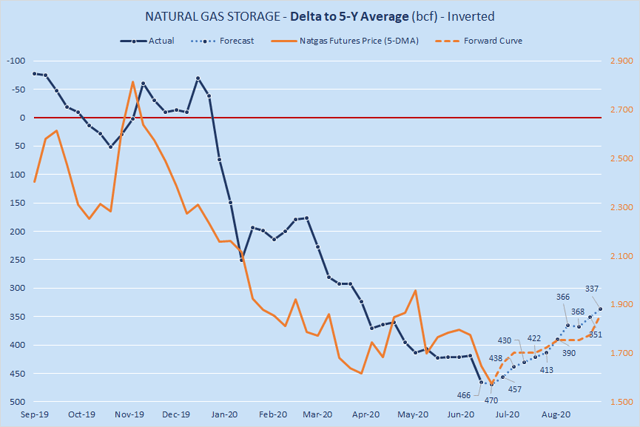
- Storage "surplus" vs 5-year average is projected to shrink by -57 bcf by July 31.
- EOS storage index is 111 bcf below market expectations.
- Weekly expectations gap for the next three reports is bullish.
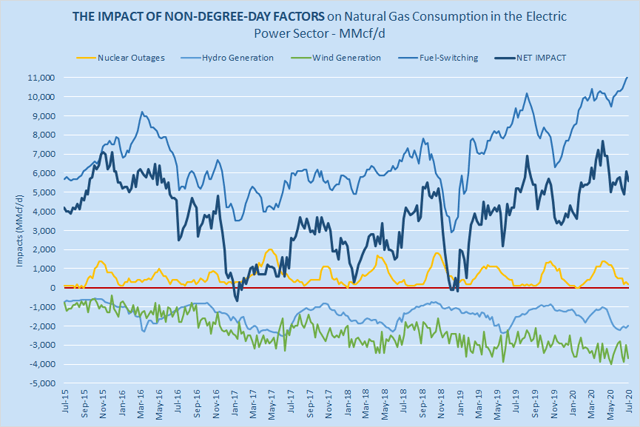
- The net impact of non-degree-day factors is bullish (vs 2019) - primarily thanks to robust coal-to-gas switching. Electricity generation from renewable sources will be getting weaker from now on (until September) due to seasonal factors.
- In the short-term, the bulls are in control. As long as natgas (Aug. contract) is trading above 1.673-1.670, the trading bias will remain bullish.
Bearish factors
- COVID-19 cases are still rising fast - preventing the states from reopening.
- Some producers began restoring output as oil prices increased. Indeed, dry gas production is up +1.7 bcf/d from May 20 low.
- LNG feedgas flows are down 1.5 bcf/d y-o-y and global LNG demand remains relatively weak so far.
- Technically, natural gas July contract is trading within a descending channel and is below key long-term moving averages. Technically, the long-term trading bias is still bearish.
- Market's EOS storage expectations are ostensibly bearish (estimated at 3,980 bcf) and although we believe that these expectations are excessively bearish, the market does not care what our beliefs are.
TECHNICALS
August Contract >>
- Support: 1.700, 1.673-1.670, 1.661, 1.650, 1.637, 1.600-1.594.
- Resistance: 1.753, 1.789, 1.800, 1.826, 1.845, 1.868.
MARKET DATA (CHARTS AND TABLES)
SD Balance
Latest Figures (daily)
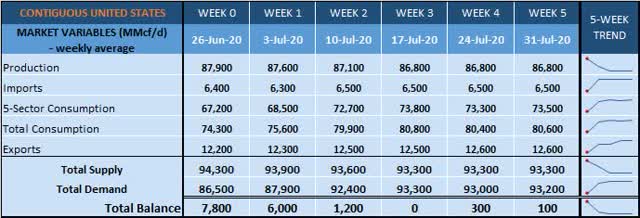
Forecast (weekly)
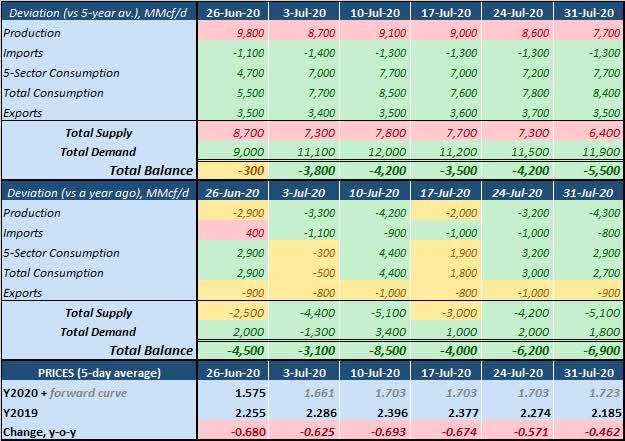
Forecast Deviations (weekly)
DEMAND
WEATHER
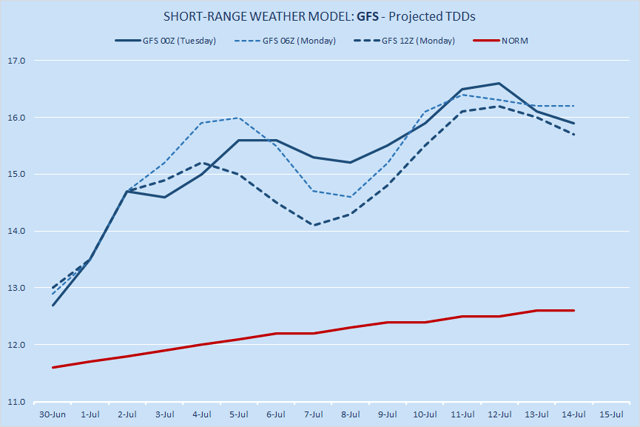
GFS Model (raw TDDs)
ECMWF Model (raw TDDs)

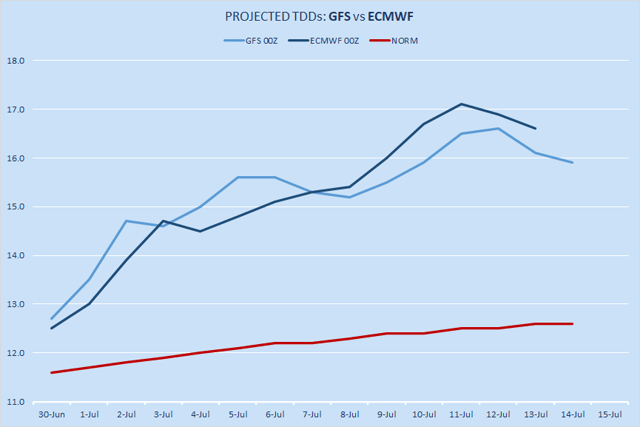
Projected TDDs: GFS vs ECMWF
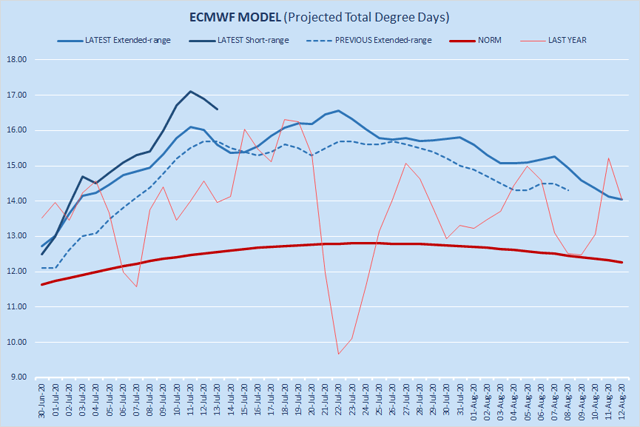
ECMWF Model: long-range vs short-range (raw TDDs)
Projected TDDs (hybrid; running aggregate)
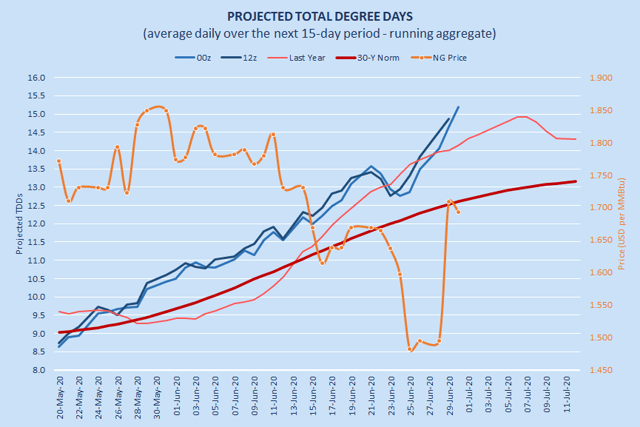
This chart DOES NOT show "historical actuals". This chart shows "historical forecasts". See full description > Total Degree Days
Consumption
Natgas consumption (7-day average) is projected to increase by 4.5% over the next 7 days (from 74.8 bcf/d today to 78.1 bcf/d on July 7).
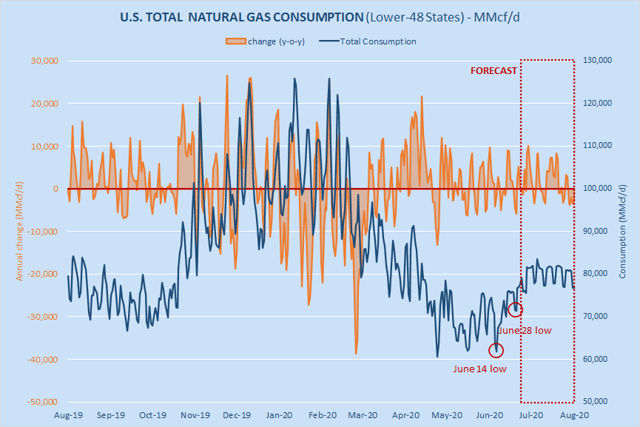
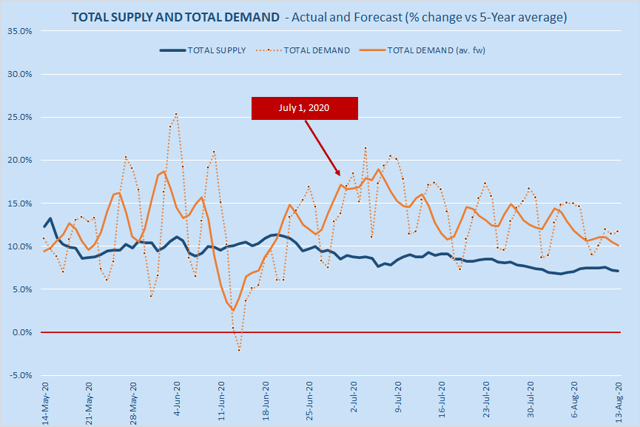
In relative terms, total demand is projected to remain mostly above the total supply curve until August 13 (at least).
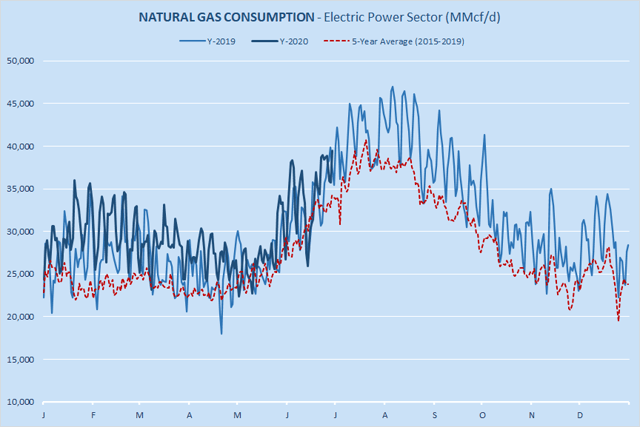
Consumption in the Electric Power sector is slightly below last year's level (the data is derived directly from the "continuous emissions monitoring systems").
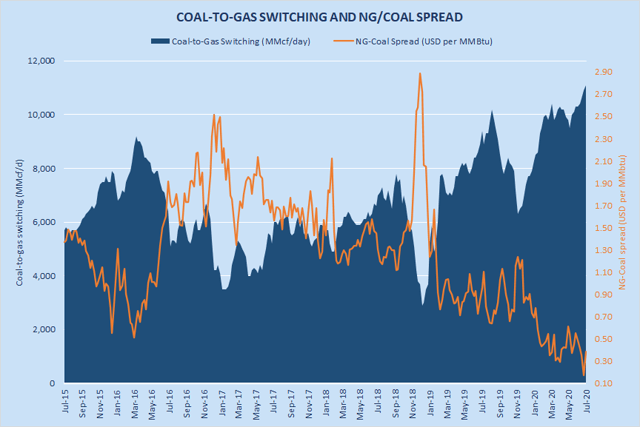
Coal-to-gas switching remains strong: 11.1 bcf/d, +1.7 bcf/d vs 2019. The net impact of four non-degree-day factors on natural gas consumption in the Electric Power sector is +5.6 bcf/d (+0.4 bcf/d y-o-y).
Exports
LNG feedgas flows are at 4.3 bcf/d.
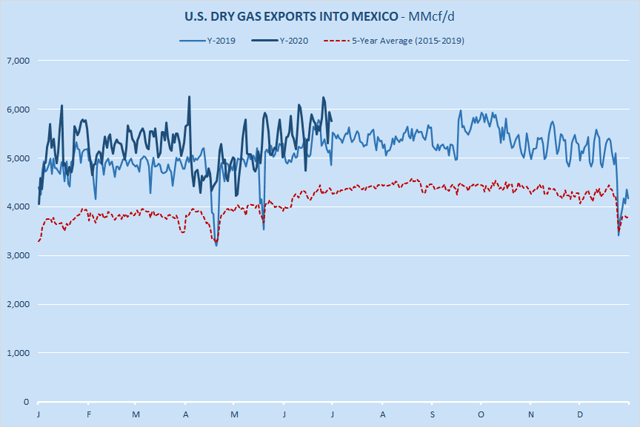
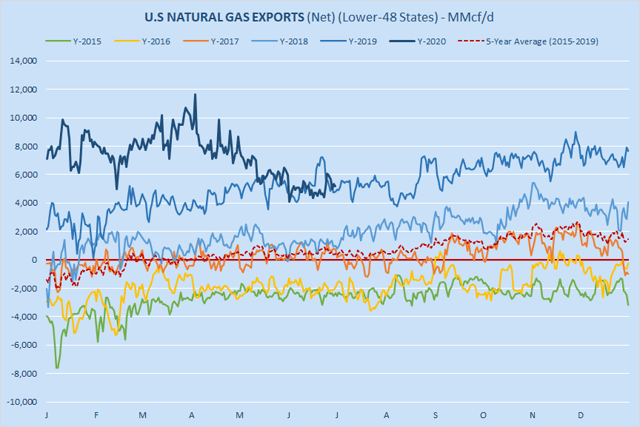
Net exports (calculated as imports minus exports) are currently estimated at 5.2 bcf/d (+0.4 bcf/d y-o-y).
SUPPLY
Production
Latest dry gas production estimate (for contiguous United States): 87.3 bcf/d.
- -9.1 bcf/d from an all-time high;
- +0.2 bcf/d from a 3-week low;
- -0.6 bcf/d from Monday's results.
We currently expect dry gas production in contiguous United States to average 86.99 bcf/d over the next three months (June-July-August). Annual growth rate is projected to be negative.
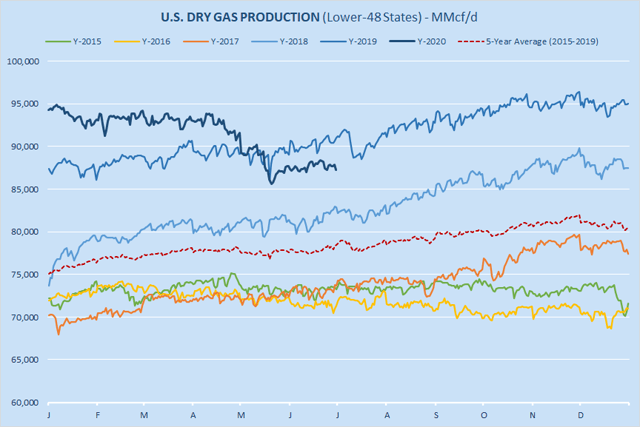
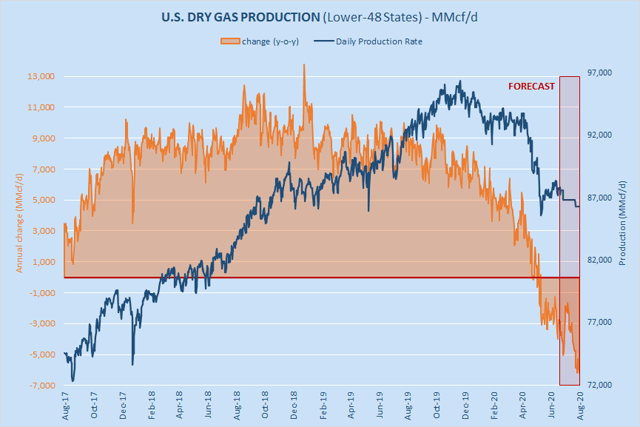
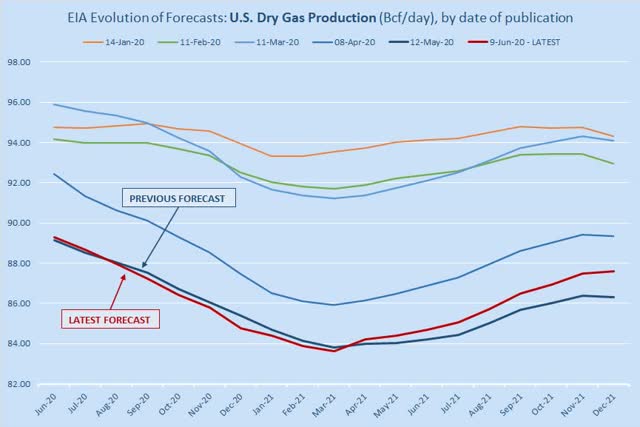
EIA has revised higher its U.S. dry gas production forecast by +0.24 bcf/d (on average). EIA currently expects dry gas production to average 86.03 bcf/d over the next 19 months (June 2020 - December 2021). EIA still projects that U.S. dry gas production will continue to decrease until March 2021.
Net supply (calculated as dry gas production minus net exports) is currently estimated at 82.1 bcf/d, 4.2 bcf/d below last year's level.
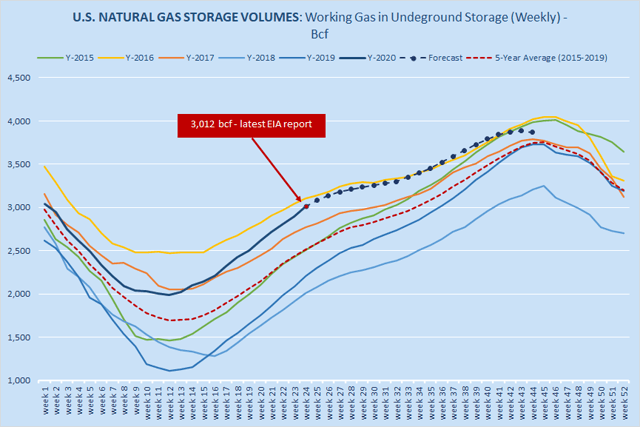
STORAGE
Our storage level outlook was revised lower (vs Monday's results), but mostly in the mid-term. Currently, EOS storage index is at 3,869 bcf (111 bcf below market expectations).
Our EOS storage index is below market expectations, but the index is very unstable due to its long-term nature.
Weekly "expectations gap" for the next three reports is bullish.
Annual storage "surplus" is projected to shrink by -131 bcf by July 31.
Storage "surplus" vs 5-year average is projected to shrink (by -57 bcf over the same period).
Next Six Reports and EOS
Indices
Charts
Deviations
PRICES
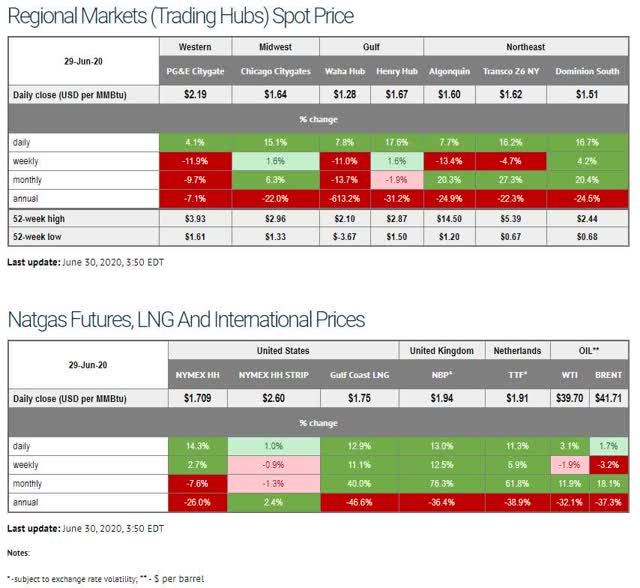
Average spot price (latest survey across seven locations): $1.64 per MMBtu. HH spot was at $1.67 per MMBtu.
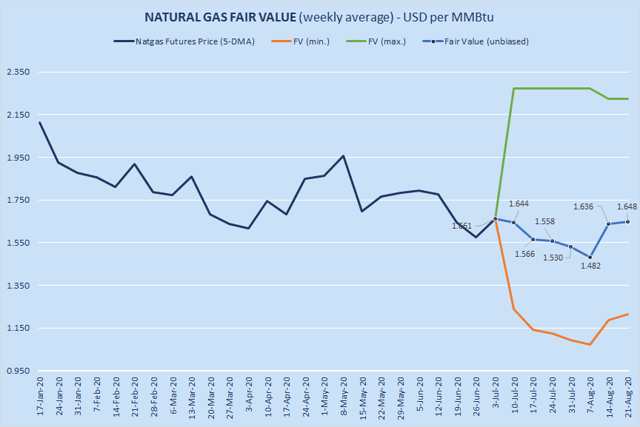
FAIR VALUE
"Fair value" – a rational and unbiased estimate of the potential market price of natural gas. It is totally hypothetical in nature and is derived entirely from historical observations over a certain time period. FV is a statistical experiment, not a fundamental indicator. FV can deviate substantially from the market price.
Forecasting the price of natural gas is exceptionally difficult, especially in the long run. The purpose of the “fair value” model is not to provide an exact price projection, but rather to show a theoretical trend potential based on fundamentals. It is equally important to remember that market is forward-looking and near-term price level can be determined by price expectations several weeks from now.
Extreme sentiment (which is quite common in natgas market) can easily drive the price below or above the "fair value". Overall, the concept of a "fair value" - even if it is econometrically sound - may not be particularly useful in trading.
Disclosure: No open positions. We are planning to re-enter the market in July or August.


