
Nasdaq 100, Crude Oil And EURAUD Stage Head-and-Shoulders Patterns
Significant market reversals are the market development that many traders spend the bulk of their time pursuing whether through technical or fundamental staging. However, markets spend far more time committed to trend and/or holding to congestion. That disconnect between probabilities and appetites can often lead to pain. Yet, markets do turn. So, how can we better position ourselves to sort the merely appealing staging of familiar chart patterns to something that better approximates to a genuine shift in the mass’s conviction?
As far as false hopes go, the head-and-shoulders pattern sought after in charts across regions and asset classes may be one of the biggest offenders. Some pursue them doggedly while others may write them off altogether. Personally, I think the pattern is like any other indicator: it should be one part of a more comprehensive analysis. There is great debate over how acute the technical picture has to be in order to qualify this pattern along with a host of criteria. However, I take a more lax view of the pattern as a staging ground for a turn given that I will apply additional factors of ‘authentication’ for a genuine trend. So long as there is a correction from a high (left shoulder), higher high (head), and lower high (right shoulder) with a reasonably clean support (neckline); I will take a closer look. So let’s take a look at three such patterns that qualify in my book – and where they need additional technical or fundamental progress to verify progress.
THE NASDAQ 100 HEAD-AND-SHOULDERS PATTERN ALREADY BREACHED
First up is the tech-heavy US index, the Nasdaq 100. This is generally highly correlated to the Dow and S&P 500, but this particularly buoyant benchmark has gone the extra mile this month to hit a new record high. That high happens to also coincide with what can be considered a ‘head’ on an H&S pattern. With an even shoulder line around 10,125 and the record peak of 10,300, this looks like a loaded pattern. Furthermore, this past Friday, we broke the ‘neckline’ which would be the qualifier for very rudimentary textbooks as the cue for the reversal. I’m not so confident.
Chart of Nasdaq 100 with 100-Period Moving Average (2 Hour)
(Click on image to enlarge)
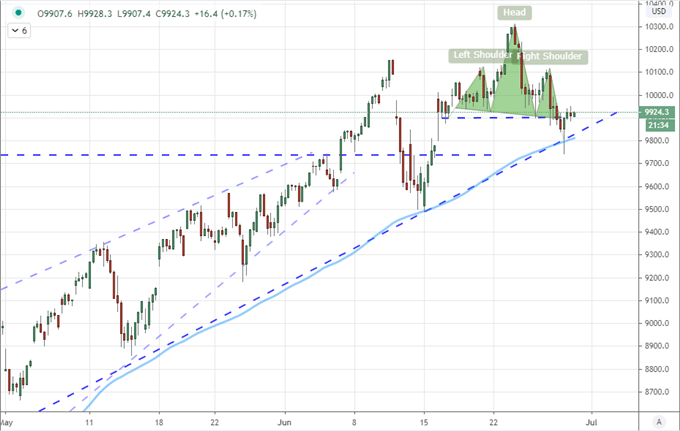
Chart Created on TradingView Platform
As far as the ‘turn’ perspective in the index’s recent price action, I think there is certainly a lot of attention being paid to the Nasdaq – particularly because the tech sector of the US equity market has been the focal point of a lot of outperformance within the US equity space (which is itself is an outperformer relative to global peers). That said, the break from Friday hasn’t seen follow through on Monday and there remains a fairly weighty support below in the area of 9,800 – 9,750, which is the former February swing high, the 100-period (on 2-hour chart) moving average and trendline support stretching back three months. If that collective support gives – and particularly if accompanied by a broad risk aversion – my confidence on a bearish trend reversal will be significantly bolstered.
CRUDE OIL IS STAGING BUT YET TO BREAK
Another head-and-shoulders pattern on my radar is the setup from crude oil this past month. This is an asset that could certainly be billed as ‘risk sensitive’, and many such markets are looking at congestion after the past three months effort to recover seriously lost ground. That said, not many of these measures are staging a clean set of technical milestones in the consolidation phase. You’ll notice below that I’m using the August futures (WTI) contract specifically to reduce the distortion from April’s negative dive. With a more aggressive ‘neckline’ support the pressure will likely come to a head soon, either negating or encouraging the pattern’s development.
Chart of WTI Oil August Contracts with 200 and 50-Day Moving Averages (Daily)
(Click on image to enlarge)
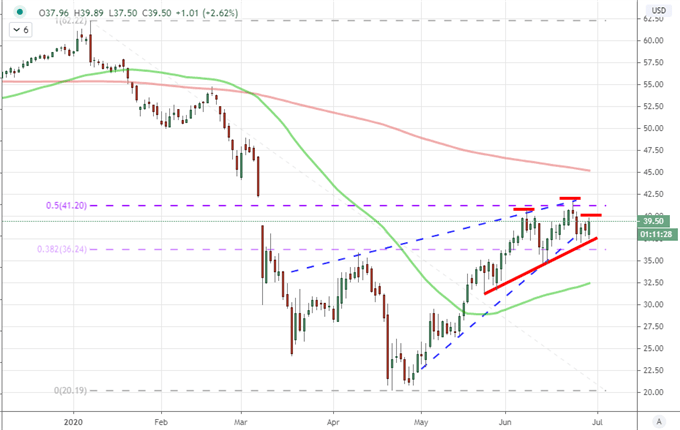
Chart Created on Tradingview Platform
For more fundamental backing, I will look for a broad risk aversion as with the Nasdaq as perhaps the strongest potential motivator for a true reversal lower in this commodity. From a technical perspective though, there is meaningful backing for both a confirmation or negation in the 38.2 percent Fib and midpoint of the 2020 range which are at 36.25 and 41.20 respectively. Even if we clear one of the other, my conviction for momentum in this particular asset will be substantially less moved than say the Nasdaq owing to its hesitations in previous months and years.
THE FX HEAD-AND-SHOULDERS ARE LESS NUMEROUS
The interesting thing about chart patterns is that the potential is often in the eye of the beholder. The cynics would say it is akin to people spotting shapes in clouds. I give technicals a little more weight than that, but there is a self-fulfilling prophecy quality in my book to such development. The more likely it is that a wide swath of the market will pick up on the turn, the more weight there is likely to be to realize the potential. With EURAUD, there aren’t as many eyes as the Nasdaq or oil would have, but there is likely to be more speculative influence. This isn’t as frequented a pair across the broader market, so that may draw more of the crowd that interprets the scene technically.
Chart of EURAUD with 100 and 200-day Moving Averages (Daily)
(Click on image to enlarge)
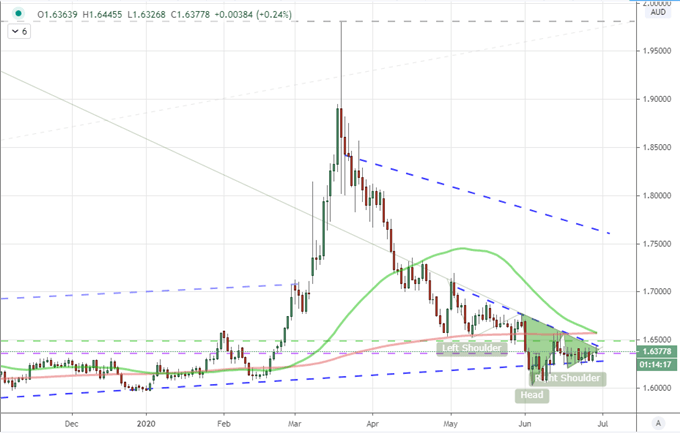
Chart Created on Tradingview Platform
This pair presents a more skewed and pattern and it also happens to be of the ‘inverted’ varieties – markets reverse higher as well as lower. Here, the exaggerated movement from February to May stages a much more dramatic backdrop which may not be easy to return to. That scale of volatility seems far outside the norm. However, if we clear the 1.6500 resistance at the same time volatility is amplified by risk aversion, this could be a very interesting pair to follow.


