
Mining ETFs: Headed For Their Next Slide?
The mining ETFs (the GDX and GDXJ) have hit resistance and look tired. After their corrective rally, a slide looks promising.
The miners are done correcting and if they were at a water amusement park, would they head for the lazy river? How about the wave pool? Nah… they’d be headed straight for the slides.
If you’ve been waiting for a high-quality sign that the next big move in the precious metals sector is underway – you just got it.
There are days on the markets when nothing happens, there are days when what happens is visible only to some (like Monday’s session), and there are days when the market’s signals are crystal-clear – as if the charts were practically screaming at the person examining them. Yesterday, was one of the latter kind of days.
Without further ado, let’s take a look at the key development that we just saw in the precious metals’ world – the big decline in the GDX ETF – proxy for mining stocks.
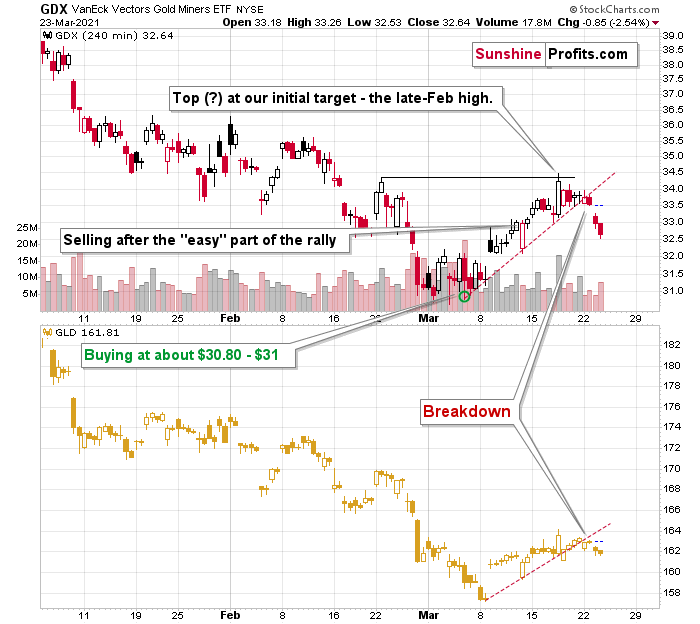
After the tiny breakdown that I described yesterday (Mar. 24), the GDX ETF declined significantly, and it even opened the session with a price gap. If you look at the left side of the chart, you’ll see that this is the way in which the big January decline started. In the next 2 months, the value of the GDX ETF declined by over $8.
But is the corrective upswing really over? Did the move higher end at a price level that was likely to stop it? Yes, definitely so.
On March 10 (when we were already long), I wrote the following:
Even though gold moved lower in early March, gold miners stopped declining after reaching my target area based on several techniques – most importantly the 50% Fibonacci retracement based on the entire 2020 rally, and the previous lows and highs. Just as miners’ relative weakness had previously heralded declines for the entire precious metals sector, their strength meant that a rally was about to start. And that’s just what we saw yesterday (Mar. 9).
Ultimately, it seems that the above corrections will result in the GDX ETF moving to about $34 or so.
The resistance levels in the $34 - $35 area are provided by:
- The late-February 2020 high
- The rising neck level of the previously completed head and shoulders pattern
- The analogy to how big miners’ correction was in April (assuming that the mirror similarity continues)
- The declining blue resistance line
- The 50-day moving average
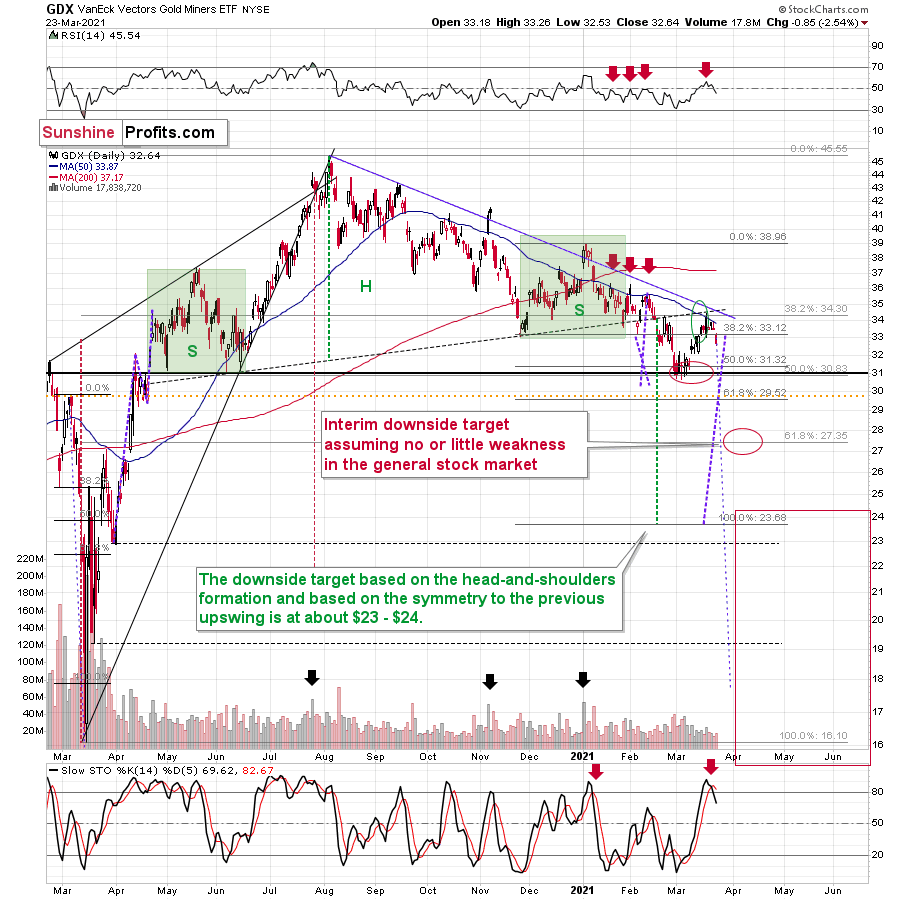
Consequently, it makes sense for the GDX ETF to slide from here, as the corrective rally that was likely to take place is most likely already over.
The clearly visible sell signal from the stochastic indicator (lower part of the chart) confirms the above as well.
Having said that, let’s take a look at an even bigger decline in the GDXJ ETF – proxy for junior mining stocks.
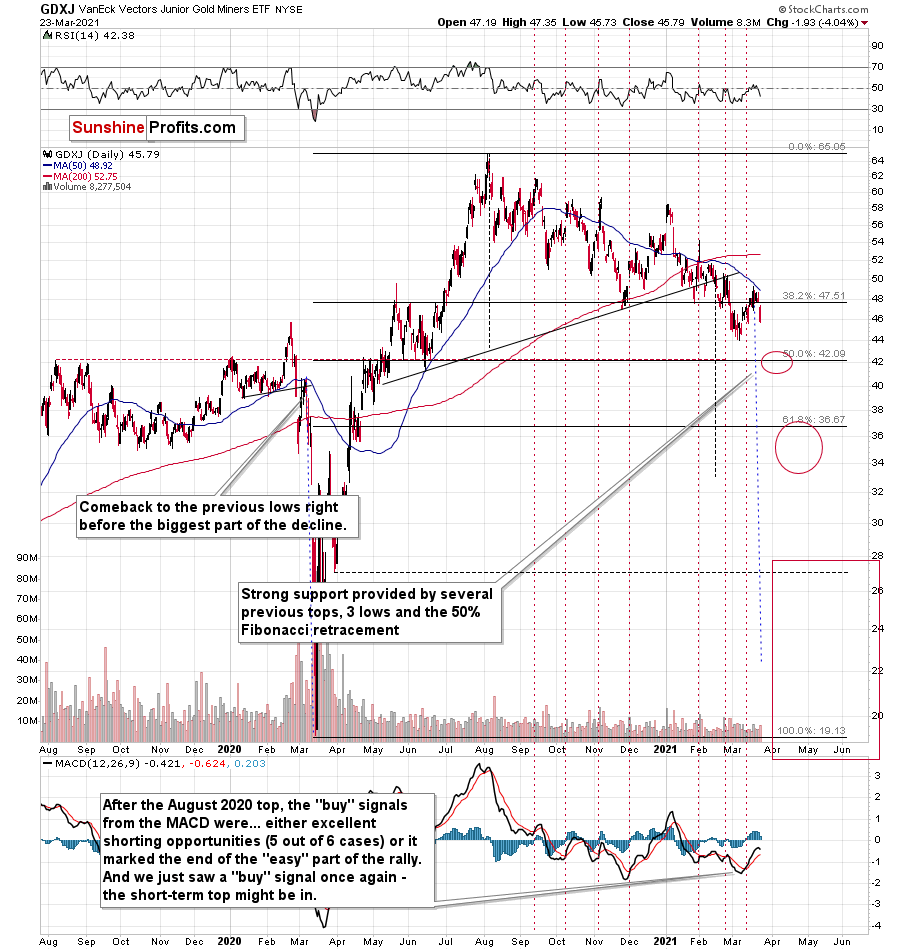
While senior gold miners declined 2.54% yesterday, junior miners declined by 4.04%.
The remarkable thing about both declines is that they took place almost without gold’s help. GLD ended yesterday’s session just 0.73% lower. The general stock market – another market that could temporarily impact the prices of mining stocks – declined by 0.76% yesterday.
In comparison, the declines that we saw in both proxies for mining stocks were huge. This is very important because the recent declines in the precious metals sector and the recent rallies in the precious metals sector were preceded by – respectively – the relative weakness of miners compared to gold and the relative strength of miners compared to gold.
What we saw yesterday is a crystal-clear sign that the waiting for the next big move lower is over.
This month’s “buy” signal from the MACD indicator seems to have once again marked a great shorting opportunity. On March 12, I wrote the following:
The above chart is a big red warning flag for beginner investors. The flag reads: “verify the efficiency of a given tool on a given market, before applying it”.
The bottom part of the above chart features the MACD indicator. Normally, when the indicator line (black) crosses its signal line (red), we have a signal. If it’s moves above the signal line, it’s a buy sign, and if it moves below it, it’s a sell sign.
But.
If one actually looks at what happened after the previous “buy signals” in the recent months, they will see that in 5 out of 6 cases, these “buy signals” practically marked the exact tops, thus being very effective sell signals! In the remaining case, it was a good indication that the easy part of the corrective upswing was over.
I’m not only describing the above due to its educational value but because we actually saw a “buy signal” from the MACD, which was quite likely really a sell signal.
I recently added that the MACD indicator is far from a light switch. While false buy signals often precede material drawdowns, the reversals don’t occur overnight. As a result, it’s perfectly normal for the GDXJ ETF to trade sideways or slightly higher for a few days before moving lower. This is what we saw last week.
And yesterday, we saw the 4%+ daily slide, which means that everyone who shorted the market based on the MACD’s “buy” signal is already profitable.
Once again – please remember to check whether a given technique or indicator actually worked for your favorite market before applying it and entering a trade.
Another market that appears to confirm the bearish narrative is silver.
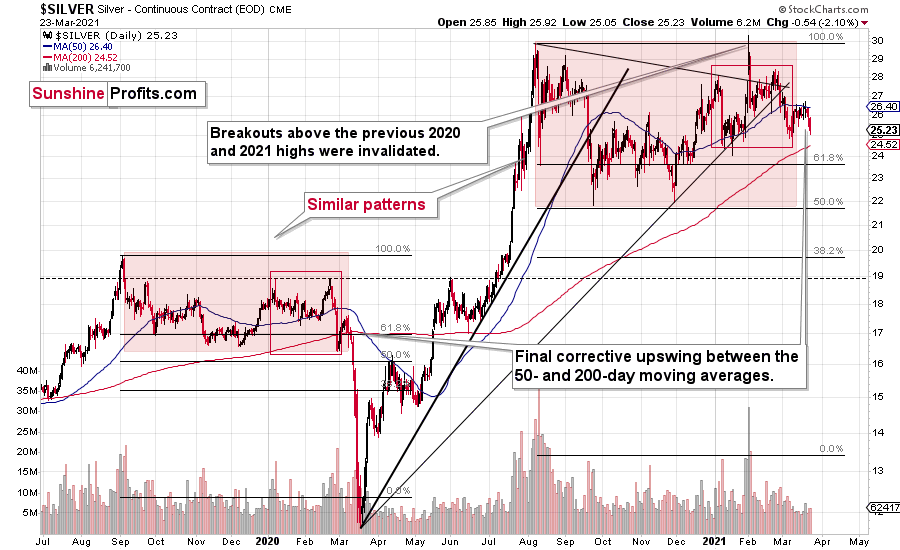
Silver moved lower in a more visible manner, which might be surprising to some investors (especially those that went long based on the “silver short squeeze” movement almost two months ago), but it’s not surprising to me. If history repeats itself to a considerable degree, then it’s not odd to see the same kind of performance that we saw in the similar stage of a given price move.
In this case, I already discussed the self-similarity present in the silver market, and I marked similar patterns with red rectangles. The current situation seems similar to early March 2020, when silver was just starting a major decline while being between its 50- and 200-day moving average. Let’s keep in mind that gold actually moved to a new high in early March, and silver was very far from doing so. Back then, silver underperformed, so it’s no wonder that it’s underperforming right now. While the silver shortage was the topic of the day for many days about two months ago, it seems that more bearish headlines will soon be more popular.
Please note that a move below ~$24 in silver will imply that everyone who bought in late January or February, when silver was particularly popular is already in the red. As silver then moves even lower, those investors will most likely feel significant emotional pressure to sell – and some will, most likely making the decline bigger and sharper.
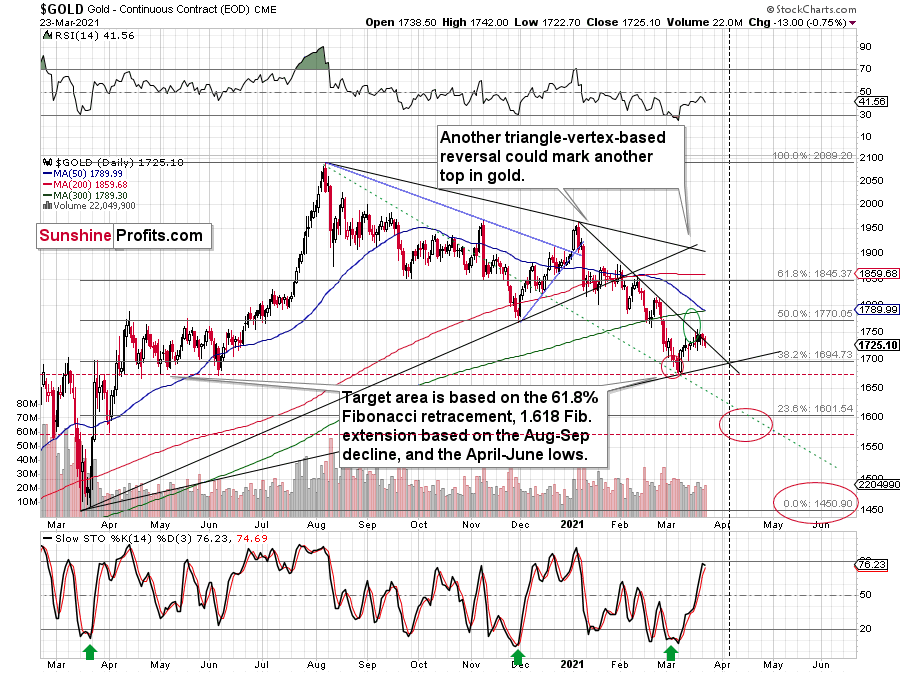
Gold seems to have topped in the lower part of my target area and the levels reached by its price as well as the levels reached by the stochastic indicator seem to indicate that the top is indeed in.
Gold reversed after failing to break above the declining short-term resistance line, relatively close to its triangle-vertex-based reversal, which is a bearish combination. The stochastic (lower part of the chart) didn’t move to the 80 level, but it was very close to it and it was the proximity of this level that was enough for the tops to form in quite a few previous cases – including the November 2020 top. Based on yesterday’s closing price, we didn’t see a sell signal in this indicator yet, but once we see just a little more weakness, we’ll get this confirmation. Based on what we saw in mining stocks yesterday, it seems that we’ll see it shortly.
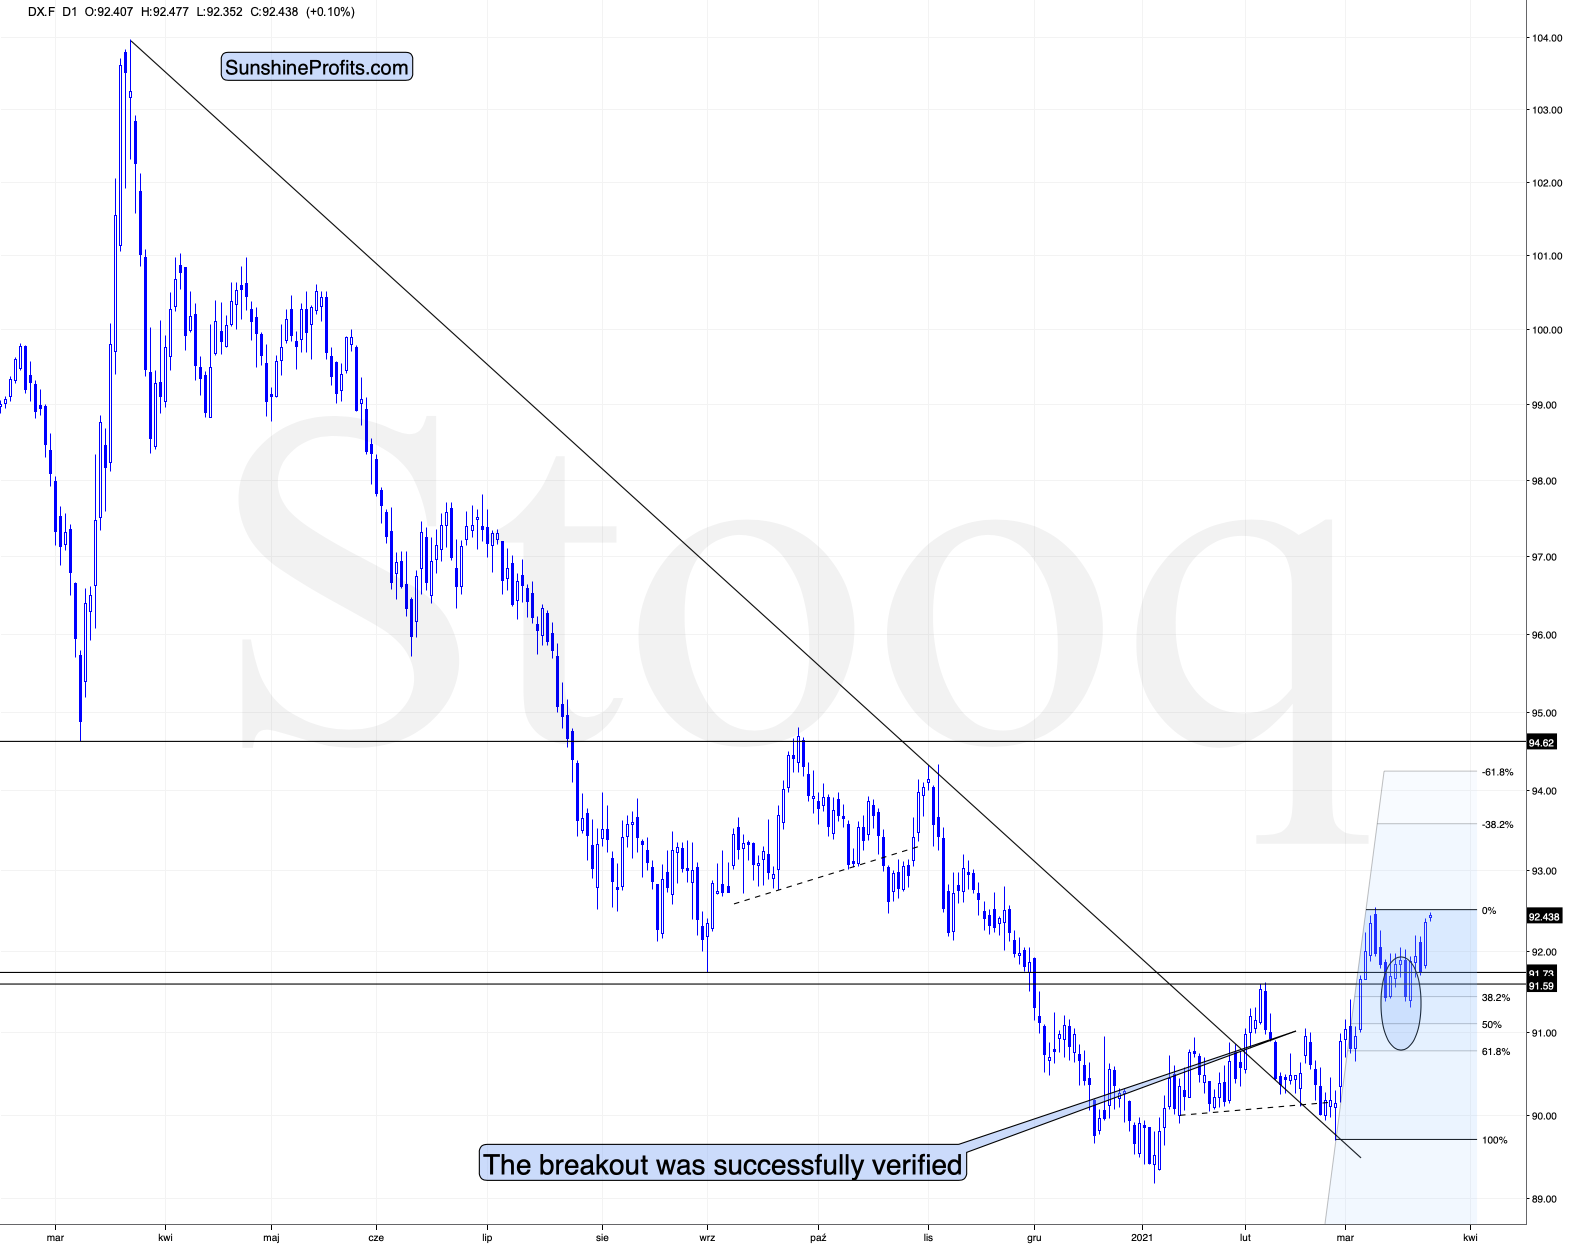
Right now, traders are likely taking the wait-and-see approach with regard to the USD Index. The latter just moved to its previous yearly highs. It’s already after verification of the breakout above the February highs, so it seems that it’s ready to break higher any day – or hour – now. When that happens, I expect the rally to take the USDX to at least 94, perhaps to 94.5 or 95. The September 2020 high is 94.8, so this level is the most likely upside target for the short term. I don’t think that the rally in the USD Index would end once it reaches the proximity of 95, but that’s when we might see another breather (perhaps after a breakout above this level and perhaps before the breakout, it’s too early to tell at this time).
All in all, it seems that the next move lower in the precious metals market is already underway and that we’re going to see new 2021 lows in gold and mining stocks in the next several weeks or days.
Disclaimer: All essays, research, and information found on the Website represent the analyses and opinions of Mr. Radomski and Sunshine Profits' associates only. As such, it may prove wrong ...
more

