
Lower Prices, Stronger Fundamentals
Since last week’s Report, the price action has been downwards.
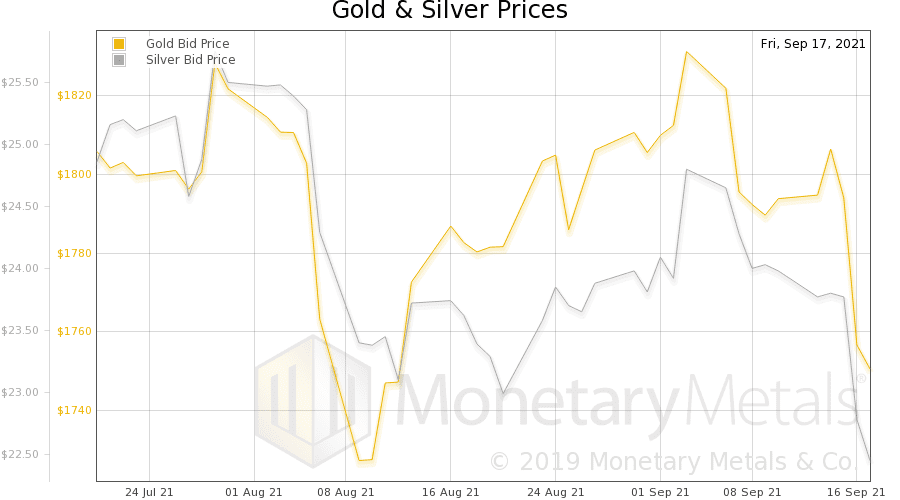
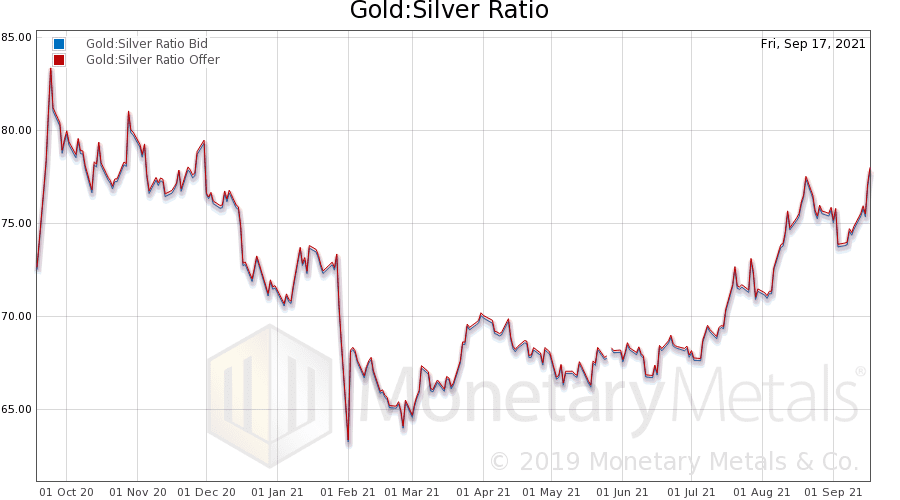
The price of gold dropped about $50, and that of silver $1.35. The gold-silver ratio rose to its highest level since the end of 2020.
Gold Silver Ratio Price Chart
Technical chartists are either throwing in the towel or tearing their hair out. We advise against tearing one’s hair out. It does not make the price go up, but it’s painful and may be permanently disfiguring. And we can offer some hope. Let’s take a look at the fundamentals for gold and silver, starting with our famous gold fundamental chart.
Gold Price Fundamental Analysis – Gold Basis
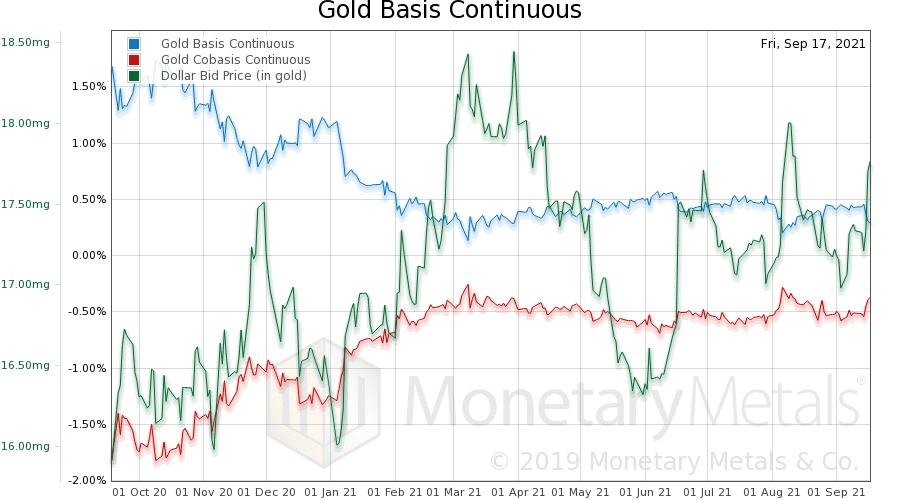
The price of the dollar is now up to 17.62 milligrams of gold (inverse to the price of gold, in dollars, of $1,750).
But notice the drooping basis. This is a measure of gold’s abundance to the market. Virtually all of the gold mined in human history is still in human hands. And of course, metal is not destroyed or created. Abundance and scarcity are measured with respect to the market. Sometimes, metal is coming to market with such abundance, that the marginal use for it is to go into carry trades. Other times, as now, the marginal source of it is coming out of carry trades.
Here’s the same chart, and fundamental analysis for silver.
Silver Price Fundamental Analysis – Silver Basis
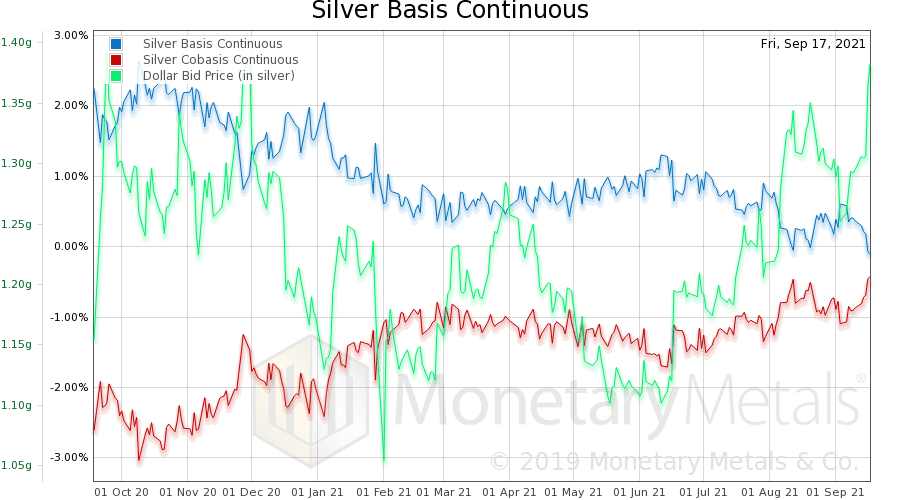
The strengthening of fundamentals is much more pronounced (as is the gain in the price of the dollar, as measured in metal).
One feature to note: the basis has gone negative. This is not the near month (i.e. December), but the 6-month continuous basis. The basis has not been this low in years. That is, silver is less abundant to the market than it has been in, in a long time. The cobasis has jumped up a lot, though not yet above zero. Thus not yet in backwardation (the Dec contract is now very close).
Finally, let’s look at the ratios of the gold basis to silver basis, and gold cobasis to silver cobasis. In other words, the relative abundance and relative scarcity of the two metals.
Gold Silver Ratio Fundamental Analysis – Gold Silver Ratio Basis Analysis
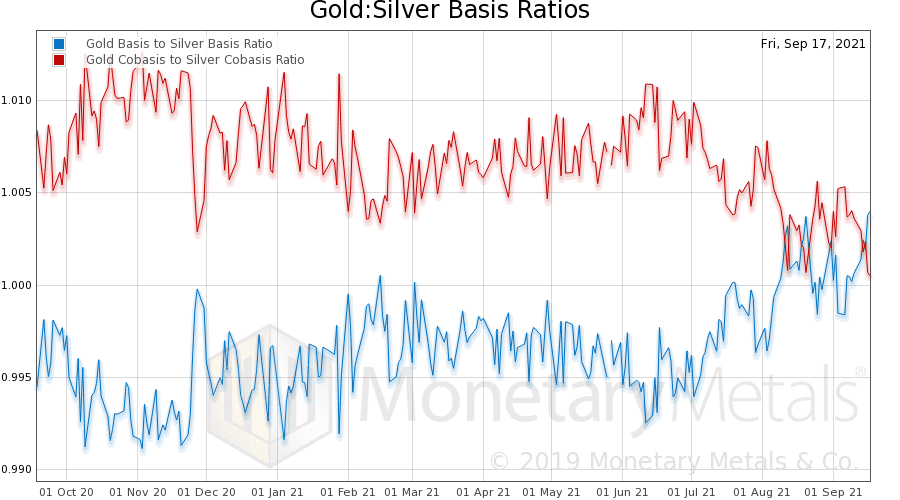
This chart is showing stronger fundamentals for silver compared to gold, and this relative strength has not been this high since Peak Covid.
Could the gold-silver ratio rise still further (i.e. silver underperform gold), perhaps due to contagion from the likely default of China’s Evergrande? Yes. It is possible. The basis cannot predict timing, nor whether the price will get farther out of whack.
The basis can only say that it is currently out of whack, and to get back into whack the price of silver needs to rise more than the price of gold.
Disclaimer: The content in this article is provided as general information and for educational purposes only and should not be taken as investment advice. We do not guarantee the accuracy ...
more

