
Looking AT 2019 With A Top-Down Approach
Today, I’d like to take a look at some things that will likely influence markets in 2019 and into 2020. I like to start the year with the top-down approach to figure out where were are in the broader economic picture. This approach helps me narrow down my investment theme for the year. I still see the potential for the stock market to base and extend into 2020, but for that to occur, a few things need to go right.
- The Democratic House needs to work with Trump and back away from trying to indite him. Some pundits believe the Democrats are willing to sacrifice the economy if it gets Trump out of office.
- There needs to be significant progress in the trade war with China. It will likely get worse before it gets better, but I believe we will reach a deal.
- The Federal Reserve needs to slow down and pause entirely.
It looks like the Fed is preparing to slow down. However, they are still on pace to reduce their balance sheet by 50-billion a month. That is a form of tightening and will affect markets negatively. Investors will be watching to see if the Fed pauses their balance sheet reductions.
If any of the above conditions blows up, we will likely see more downside in the stock market. If the Fed refuses to yield, they will push the economy into recession. Gold will remain buoyant as long as economic uncertainty endures. However, if the above conditions are met, the economy will stagger forward, and gold will begin to lose its appeal.
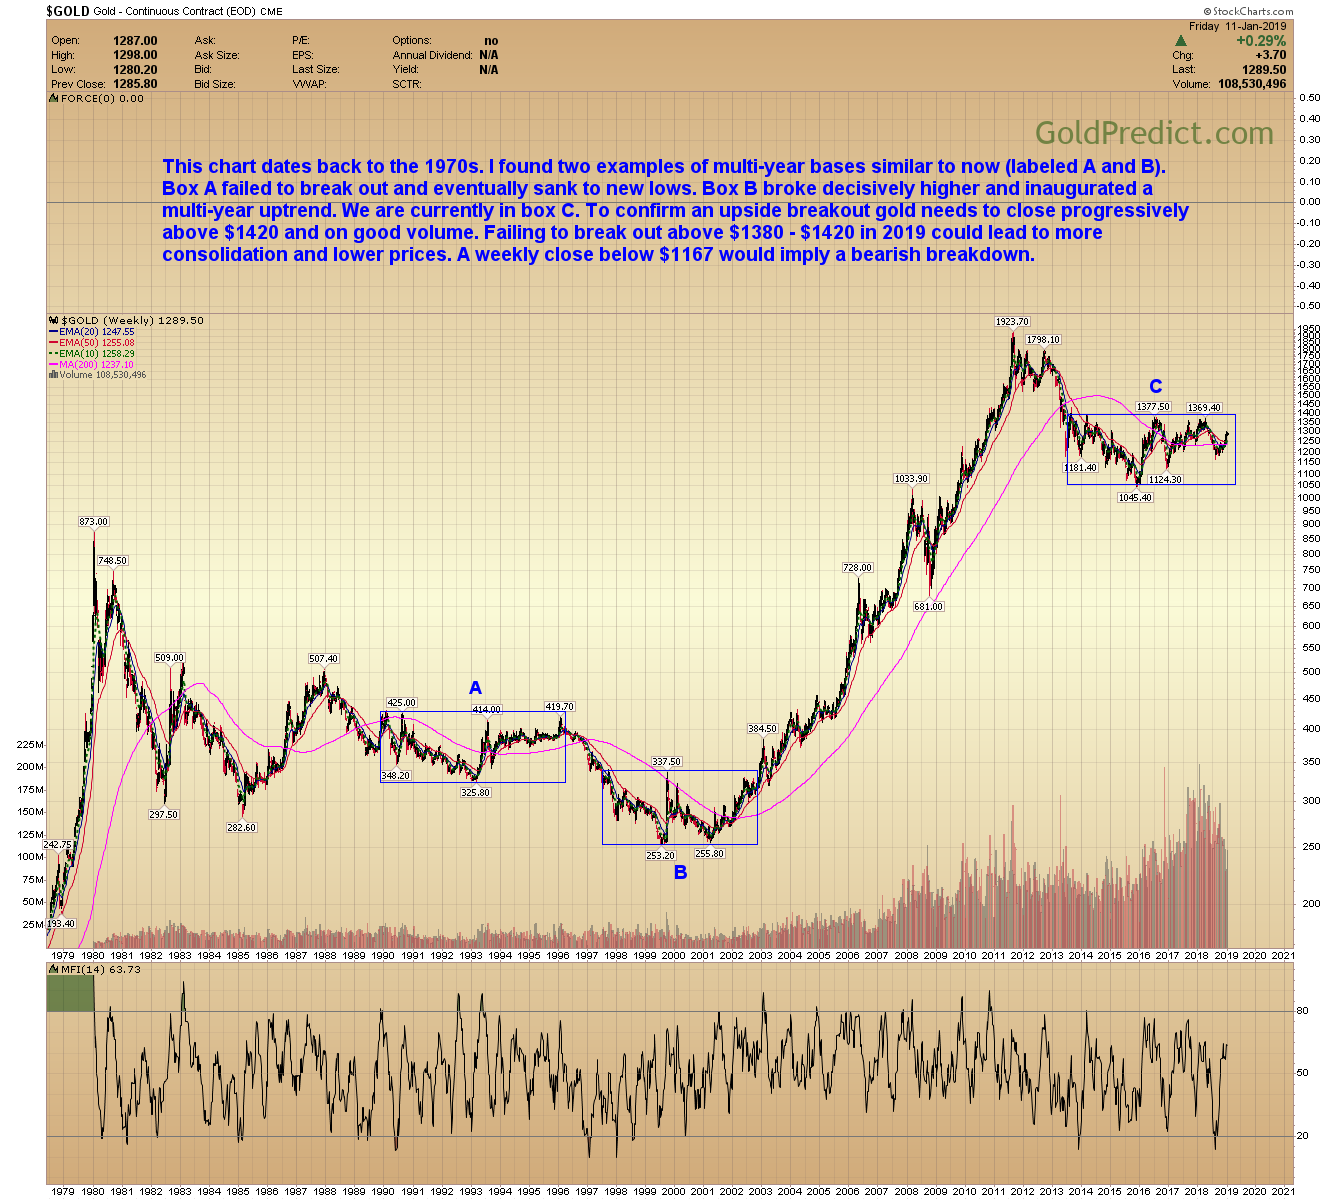
GOLD WEEKLY
This chart dates back to the 1970’s. I found two examples of multi-year bases similar to now (labeled A and B). Box A failed to break out and eventually sank to new lows. Box B broke decisively higher and inaugurated a multi-year uptrend. We are currently in box C. To confirm an upside breakout gold needs to close progressively above $1420 and on good volume. Failing to break out above $1380 – $1420 in 2019 could lead to more consolidation and lower prices. A weekly close below $1167 would imply a bearish breakdown.
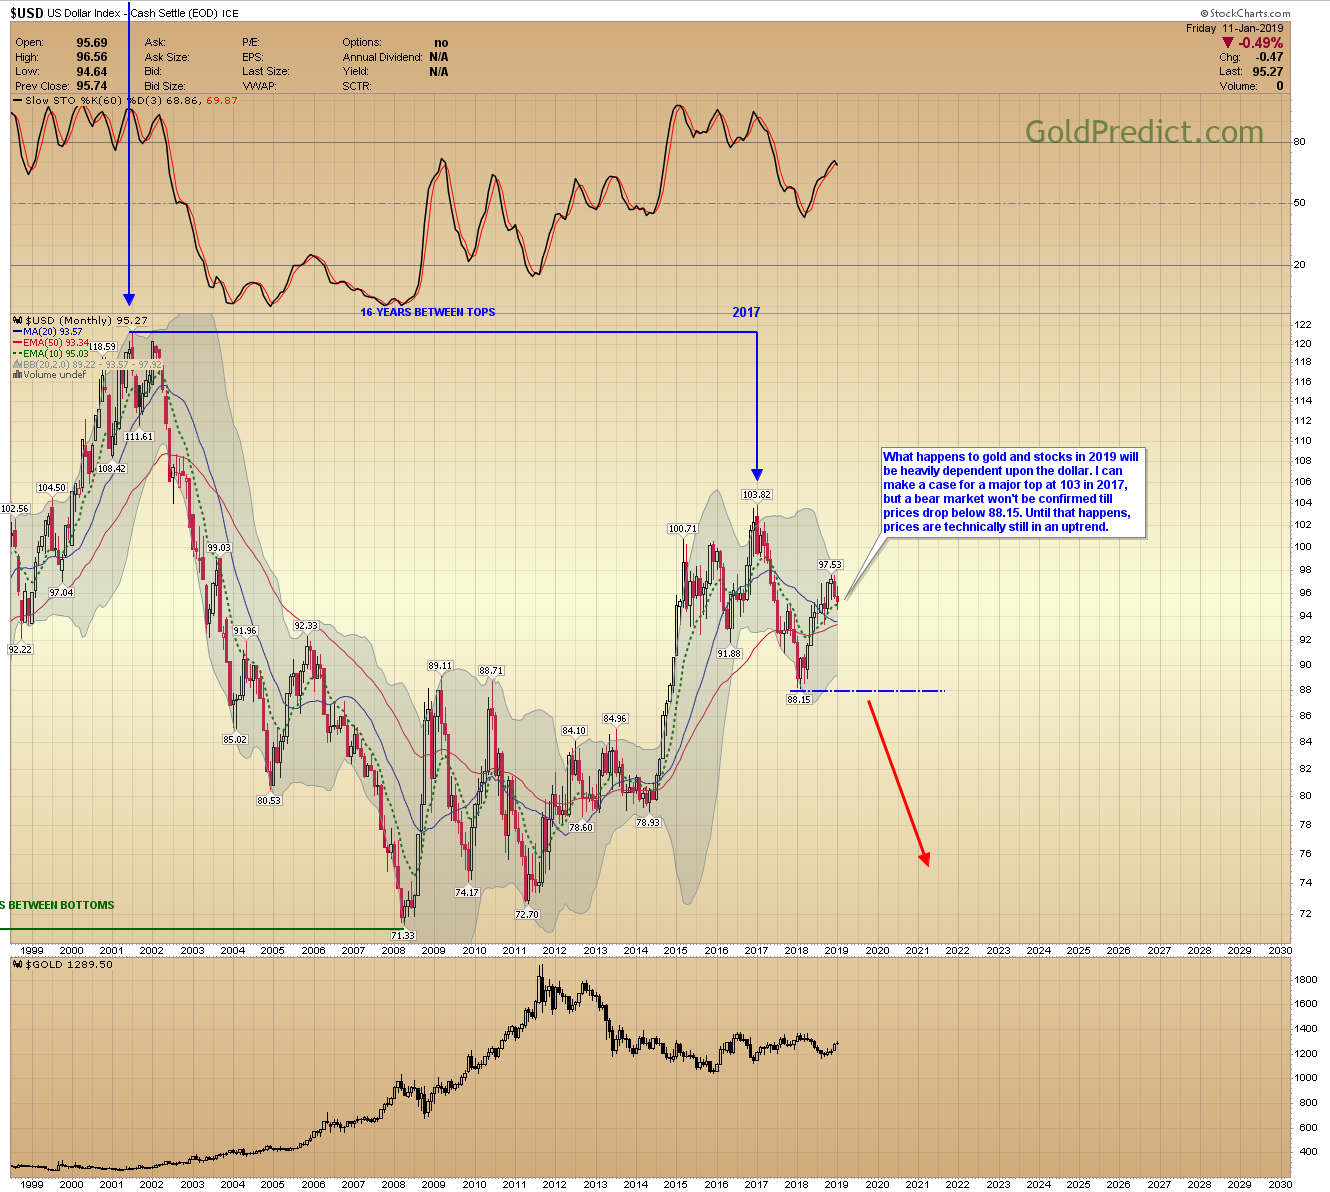
US DOLLAR MONTHLY
What happens to gold and stocks in 2019 will be heavily dependent upon the dollar. I can make a case for a major top at 103 in 2017, but a bear market won’t be confirmed till prices drop below 88.15. Until that happens, prices are technically still in an uptrend.
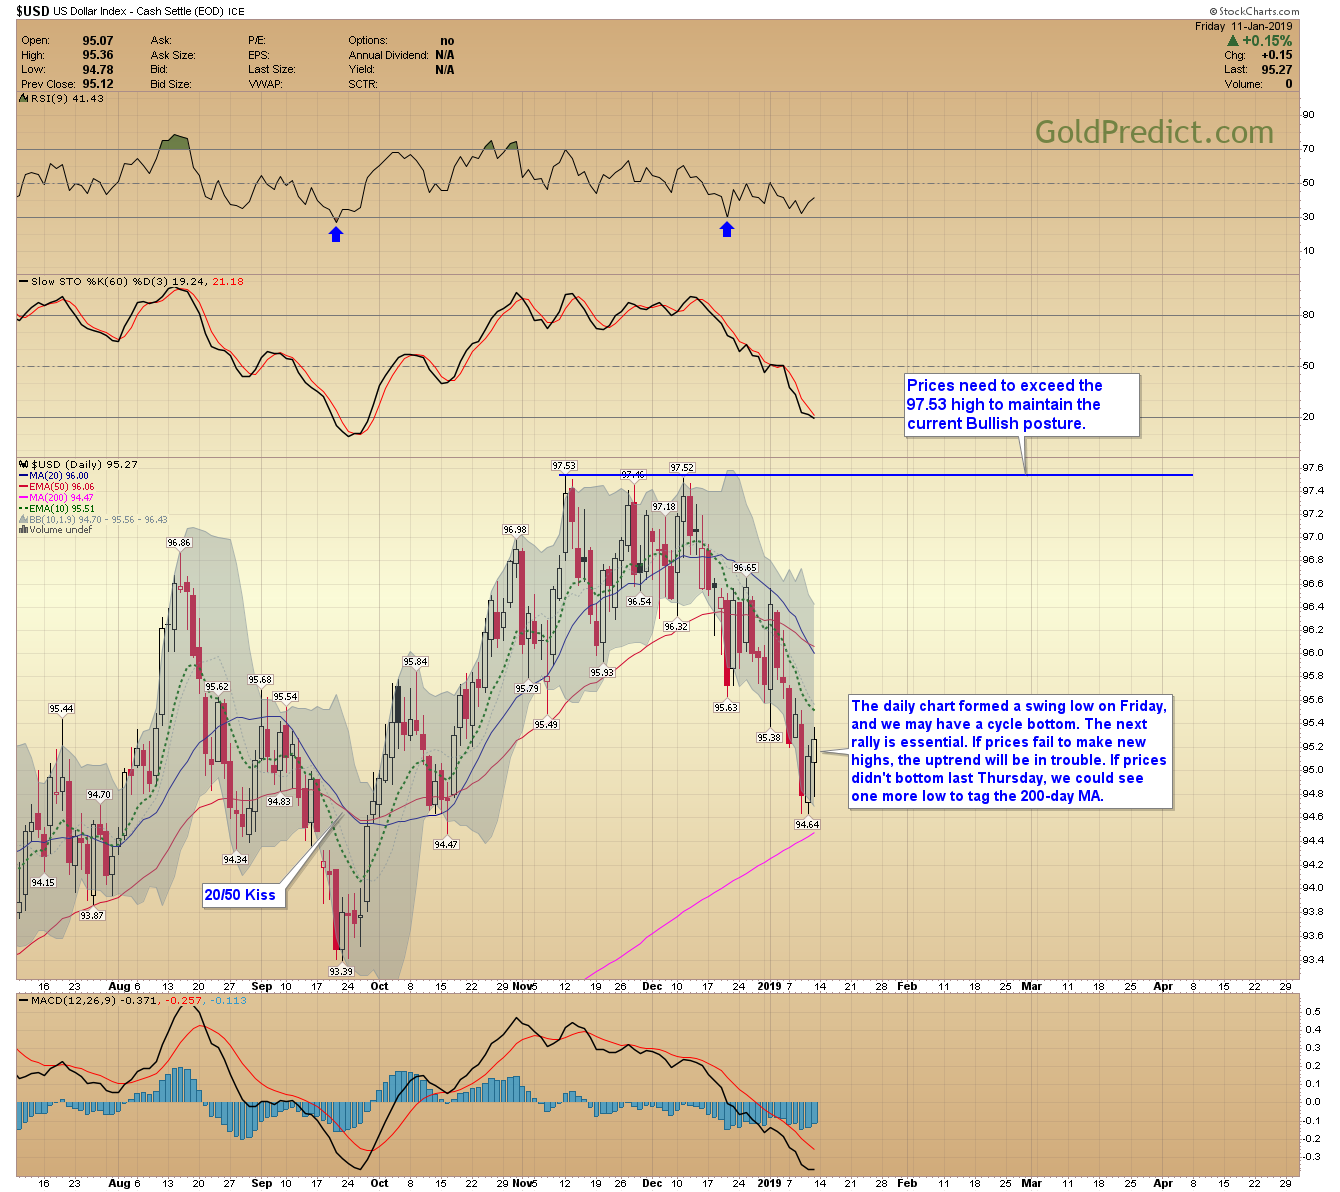
US DOLLAR
The daily chart formed a swing low on Friday, and we may have a cycle bottom. The next rally is essential. If prices fail to make new highs, the uptrend will be in trouble. If prices didn’t bottom last Thursday, we could see one more low to tag the 200-day MA.
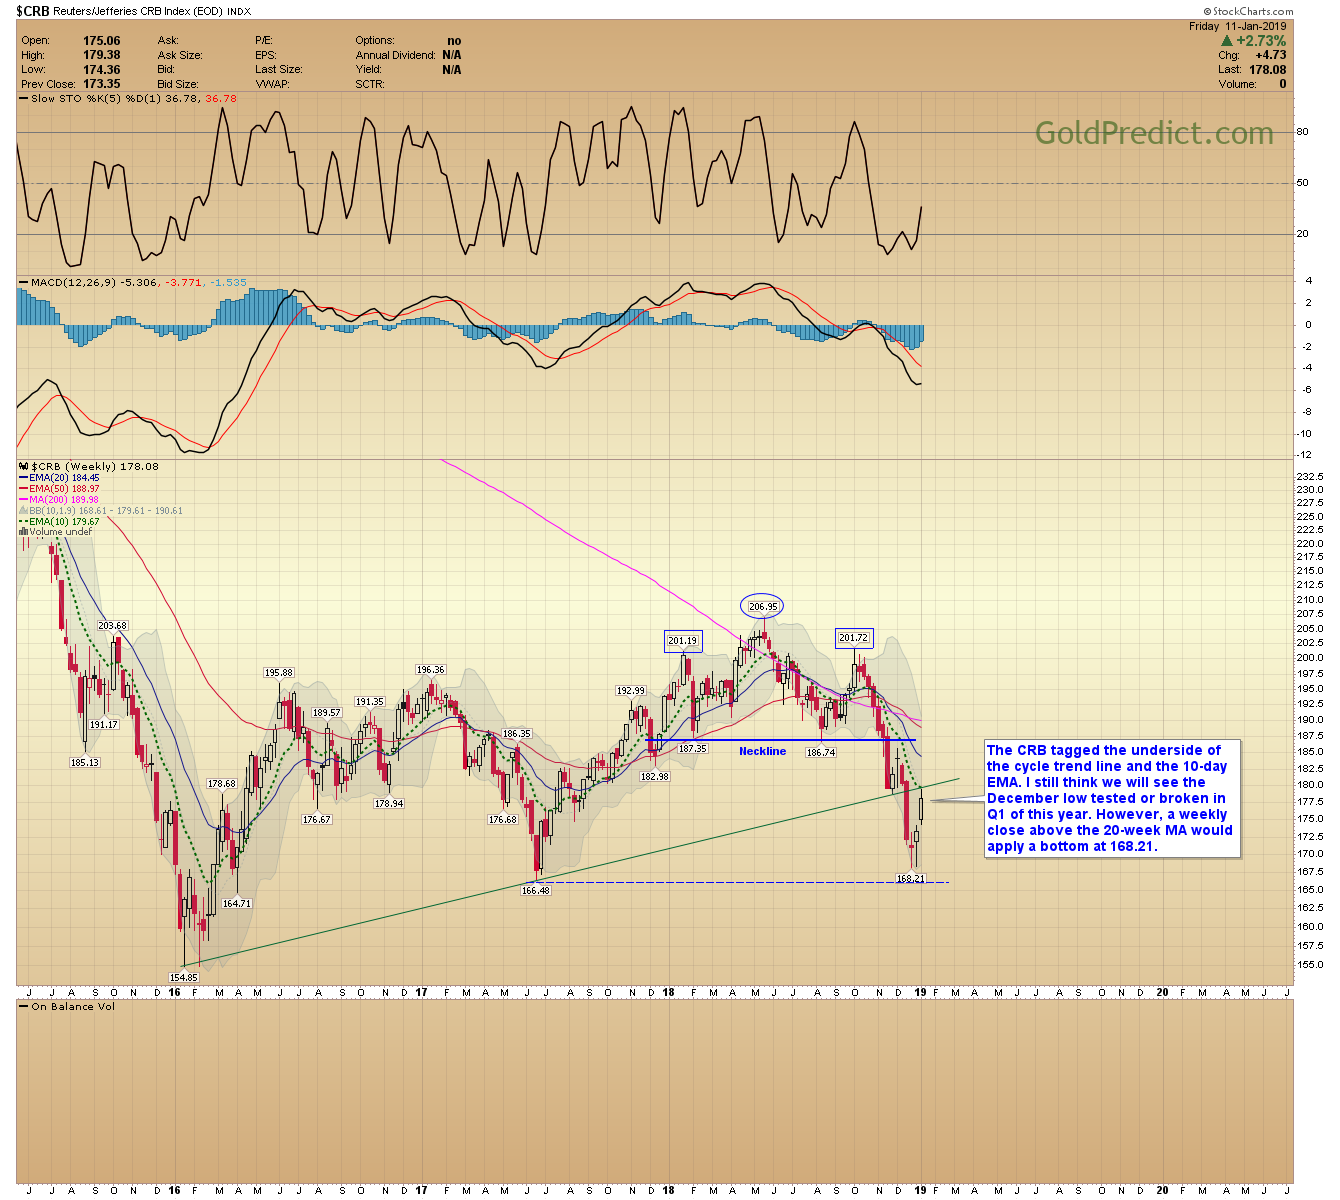
CRB WEEKLY
The CRB tagged the underside of the cycle trend line and the 10-day EMA. I still think we will see the December low tested or broken in Q1 of this year. However, a weekly close above the 20-week MA would apply a bottom at 168.21.
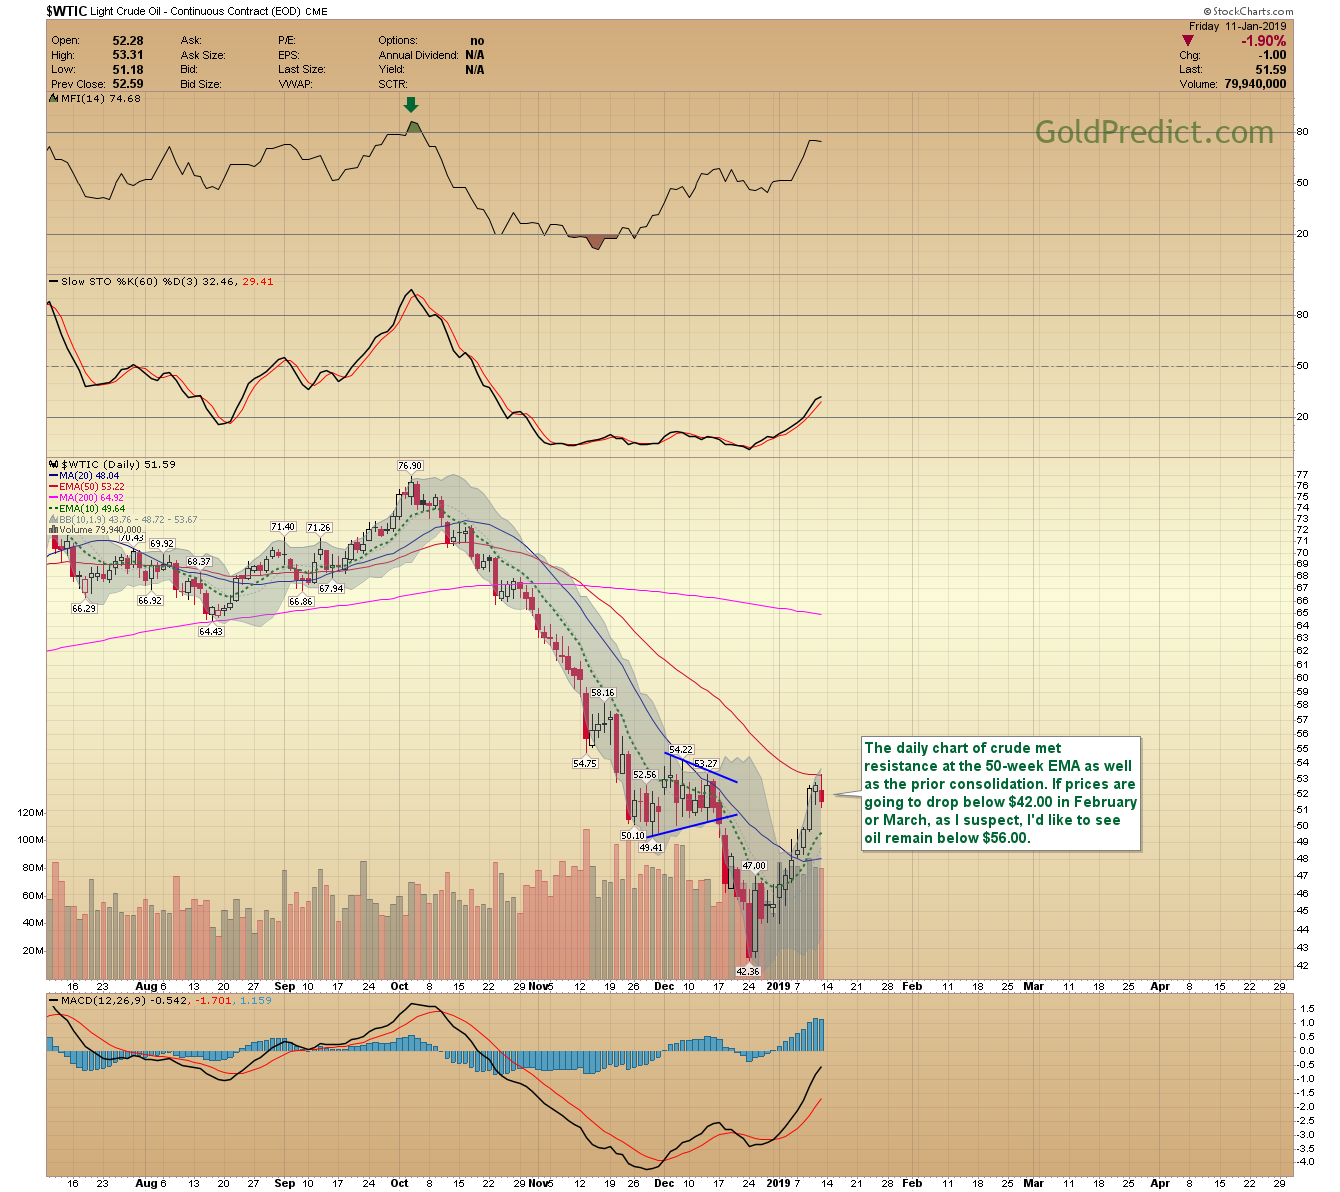
WTIC
The daily chart of crude met resistance at the 50-week EMA as well as the prior consolidation. If prices are going to drop below $42.00 in February or March, as I suspect, I’d like to see oil remain below $56.00.
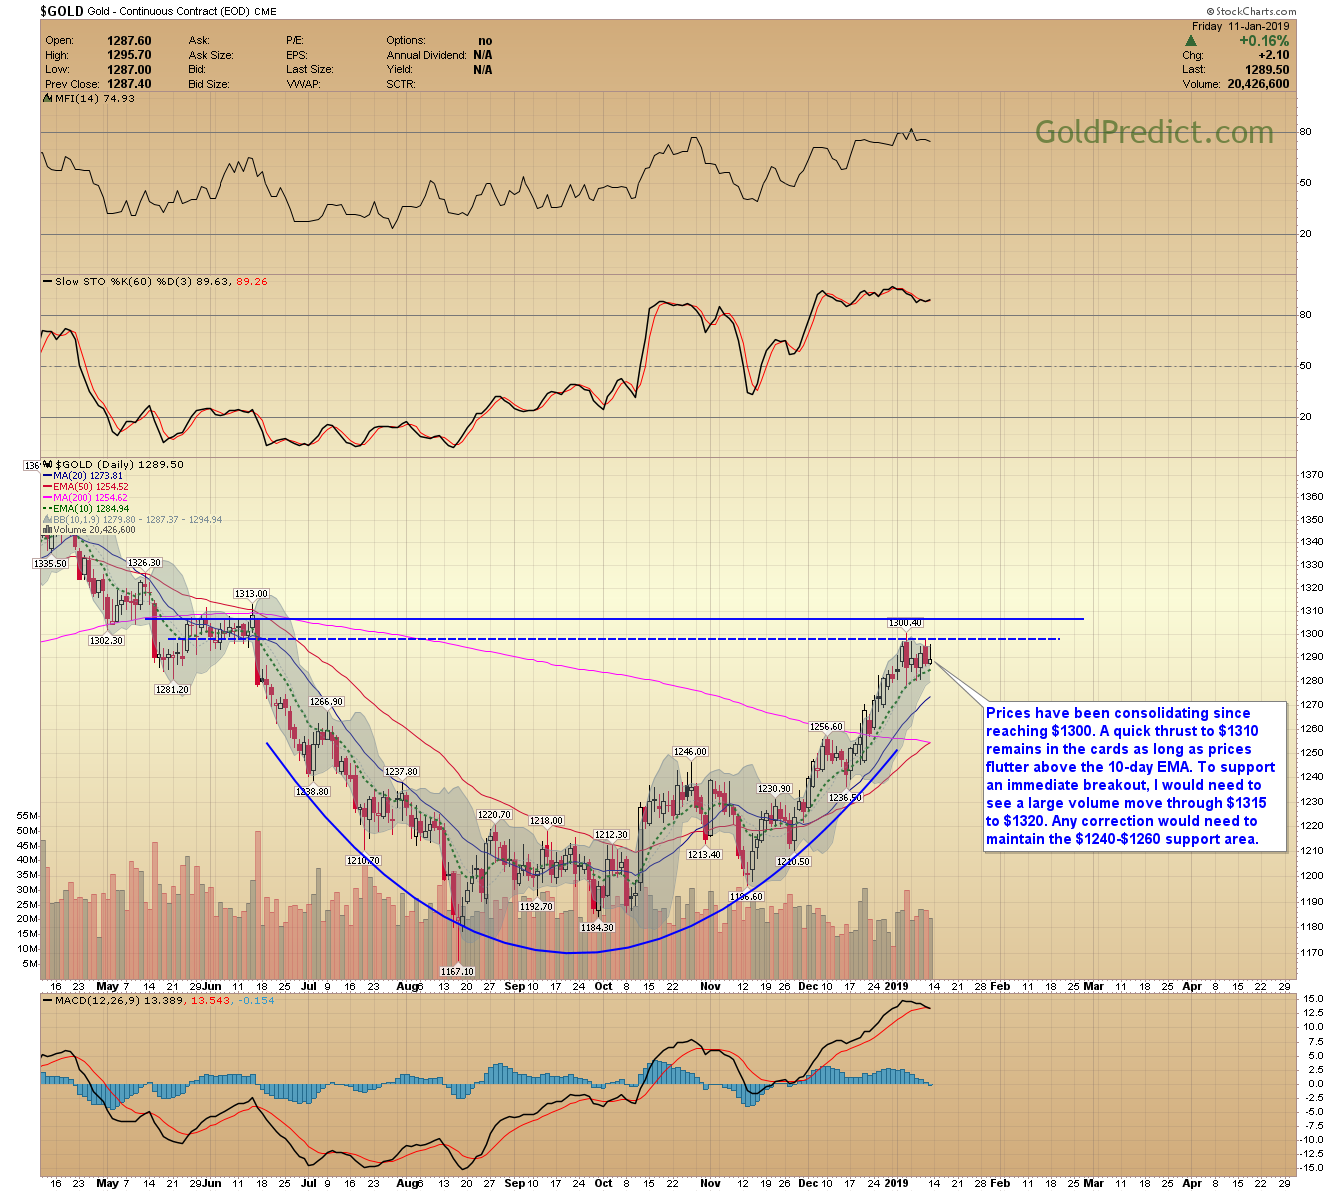
GOLD
Prices have been consolidating since reaching $1300. A quick thrust to $1310 remains in the cards as long as prices flutter above the 10-day EMA. To support an immediate breakout, I would need to see a large volume move through $1315 to $1320. Any correction would need to maintain the $1240-$1260 support area.
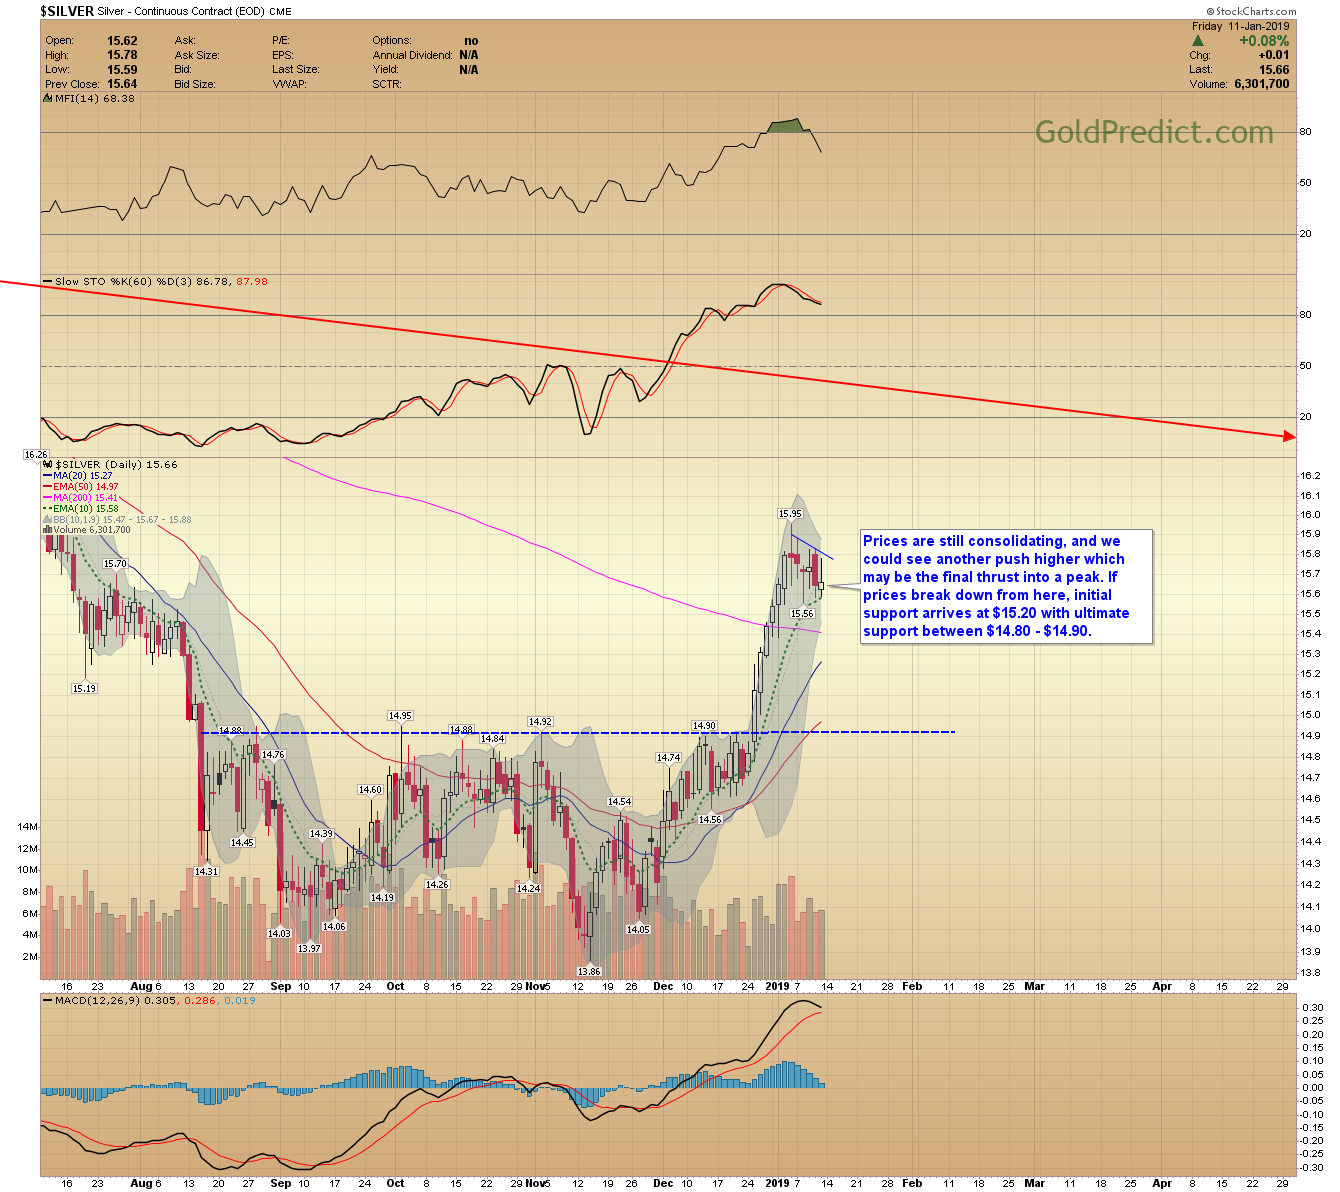
SILVER
Prices are still consolidating, and we could see another push higher which may be the final thrust into a peak. If prices break down from here, initial support arrives at $15.20 with ultimate support between $14.80 – $14.90.
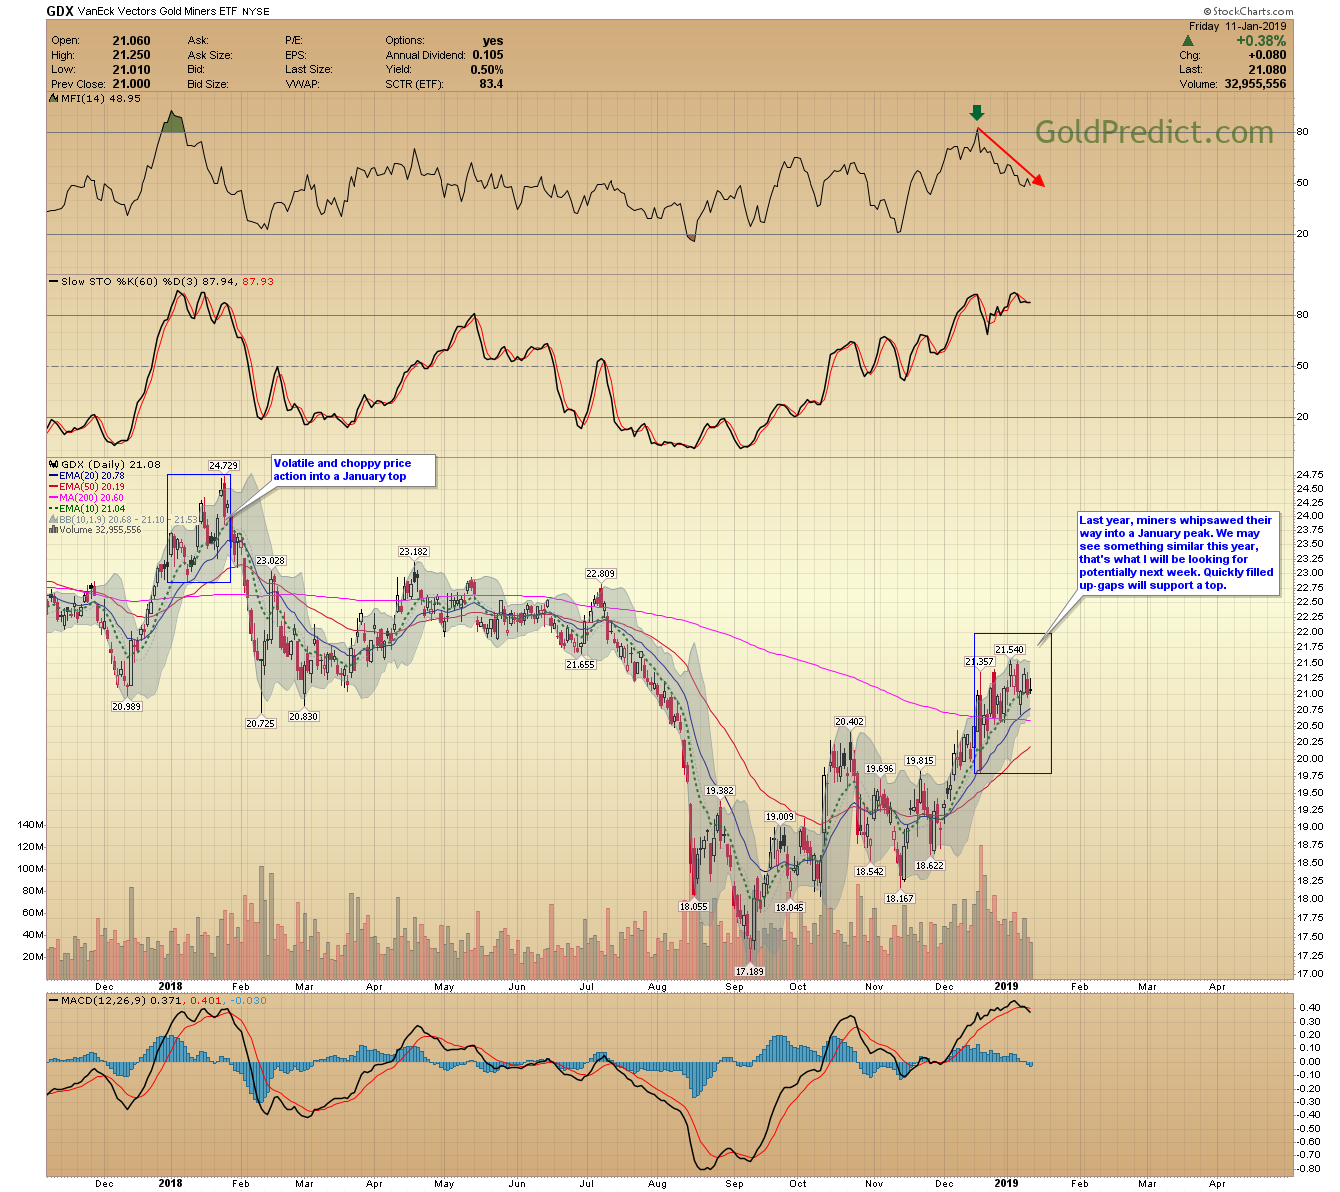
GDX
Last year, miners whipsawed their way into a January peak. We may see something similar this year, that’s what I will be looking for potentially next week. Quickly filled up-gaps will support a top.
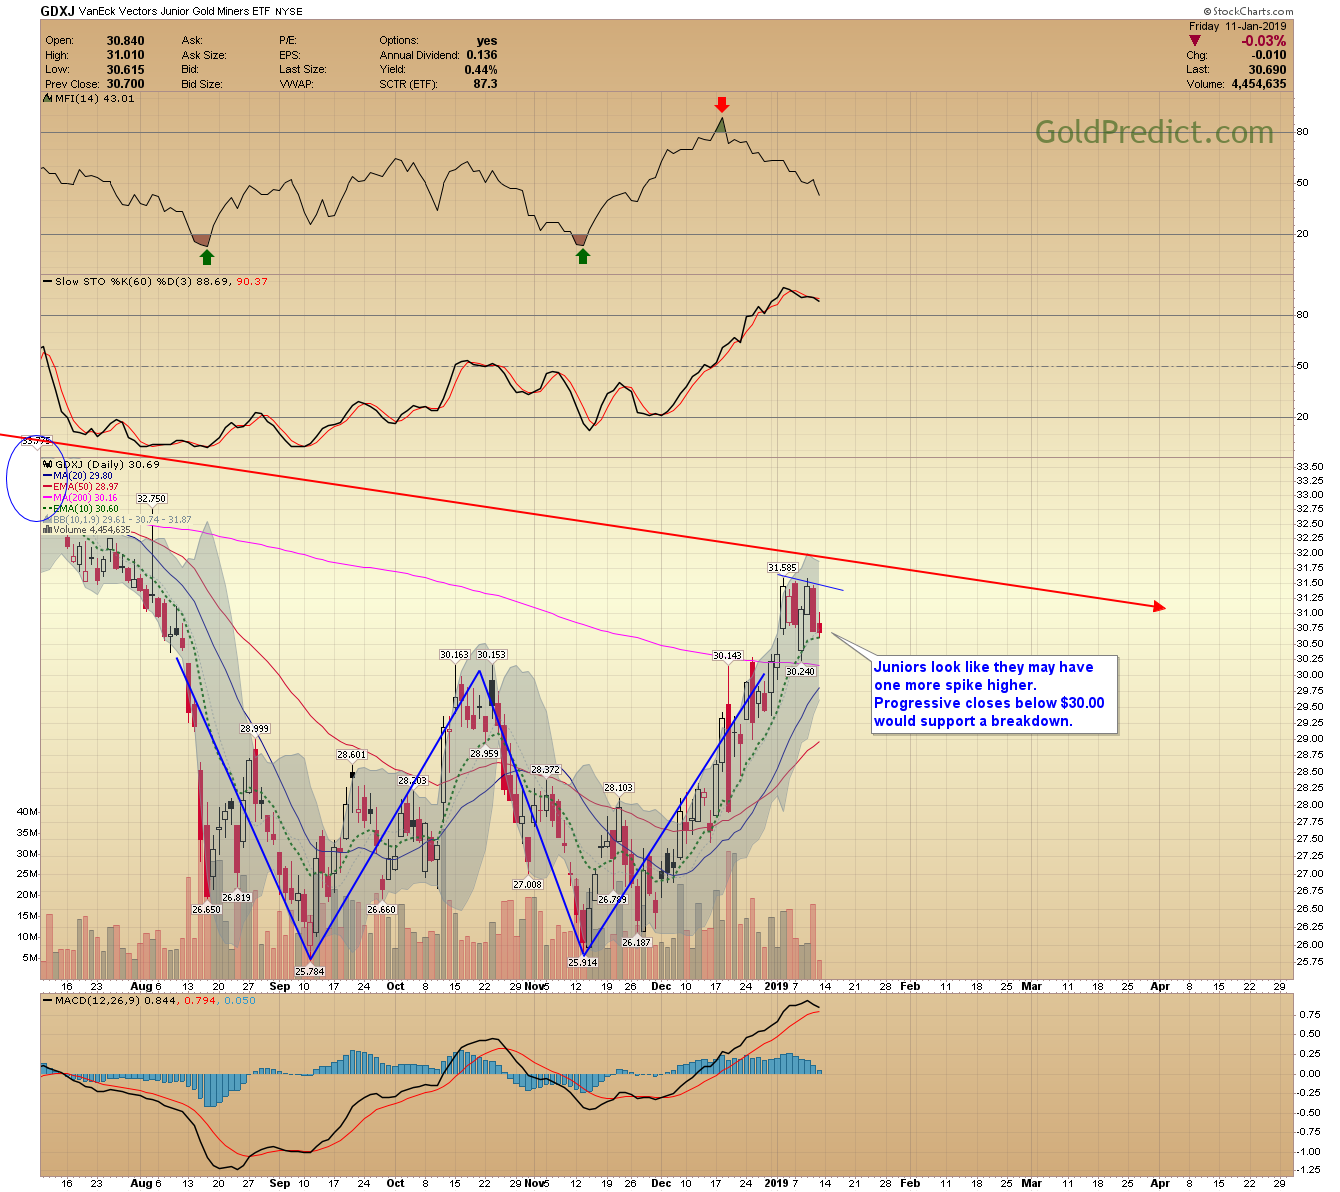
GDXJ
Juniors look like they may have one more spike higher. Progressive closes below $30.00 would support a breakdown.
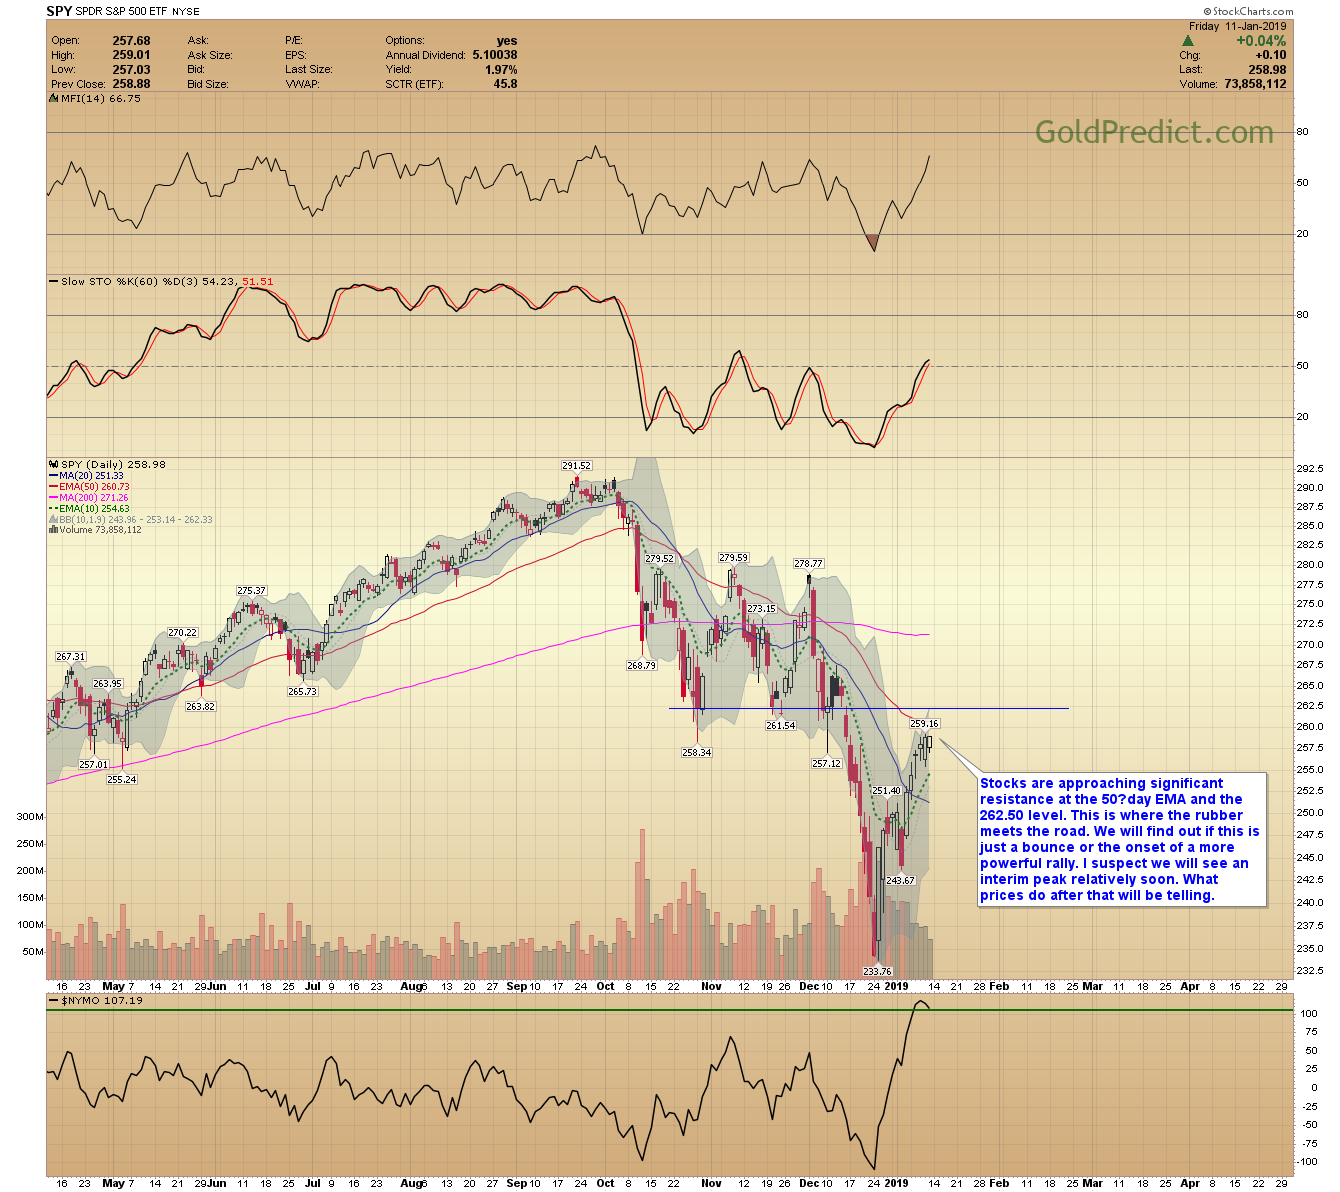
SPY
Stocks are approaching significant resistance at the 50–day EMA and the 262.50 level. This is where the rubber meets the road. We will find out if this is just a bounce or the onset of a more powerful rally. I suspect we will see an interim peak relatively soon. What prices do after that will be telling.
I’ve been trading for a long time but the last two years have been particularly difficult. Yes, trendless price action has much to do with it, but I think something else has changed.
The signals and breakouts that used to work are no longer sound. In fact, the opposite often happens. Take silver for example, there were quality high-volume breakouts above the 200-day MA last April and June. Both looked very promising – yet each lead to a significant selloff in the opposite direction. That’s just one example – there are dozens more.
After considerable contemplation and research, I’ve determined algorithmic trading and quants are responsible for these events. They often use a standard deviation model to guide their trades. So what used to be a normal breakout is viewed as a shorting opportunity to them because prices are X-standard deviations above average. The algorithms see this and instantly overwhelm markets with sell orders, aborting the breakout.
I think that is why there have been so many false starts and false breakout/breakdowns over the past few years. Going forward, we have to be careful and prepared for erroneous events. I don’t see algos going away, so we might as well learn to understand them and recognize their fingerprints.
GOLD

HOLD – NEUTRAL
SILVER
HOLD – NEUTRAL
SENIOR MINERS
HOLD – NEUTRAL
JUNIOR MINERS
HOLD – NEUTRAL
Disclosure: None.


