
Gold touched $2000/oz resistance last Friday but has so far held most of its gains in a bullish fashion. It closed Wednesday at $1995/oz.
Next Tuesday marks the monthly close.
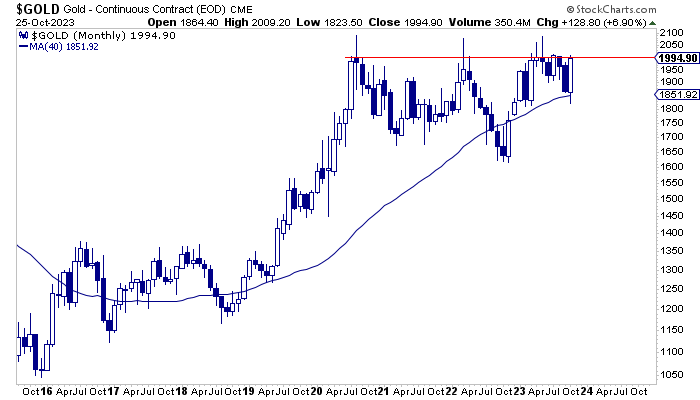
The monthly candle chart of Gold is below, with the resistance line at $2000. Gold has tested $2000/oz in seven of the past eight months.
After many tests of resistance, we need a convincing monthly close to qualify as a breakout. Think of $2020/oz at a minimum.
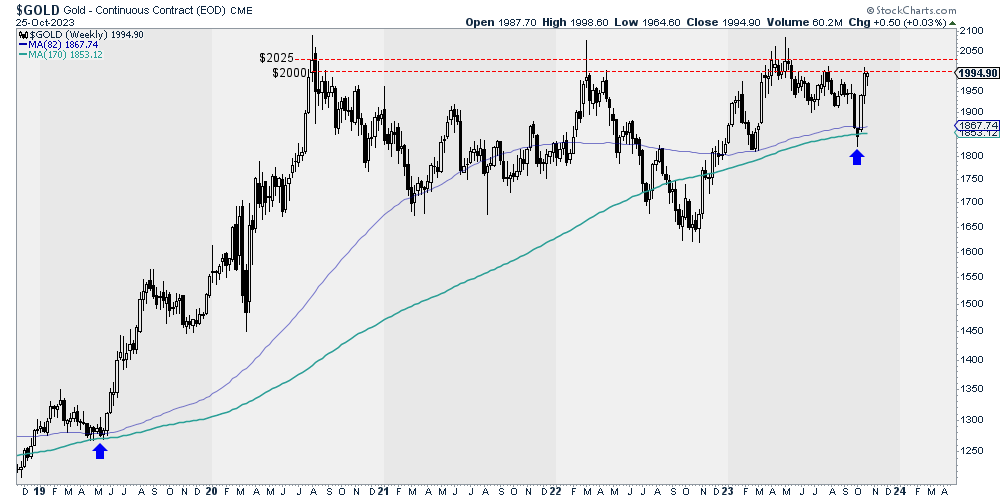
The $2000 level is also important resistance on the weekly chart.
Below, we plot the weekly candle chart with the equivalent to the 20-month and 40-month moving averages.
Weekly resistance is at $2000 and $2025 to $2030. The weekly high in 2020 was $2028; this past spring, Gold tested $2025 in six out of seven weeks.
(Click on image to enlarge)
Turning to potential support levels, Gold should find initial support at $1960 or $1940 should it lose more short-term momentum.
Gold has often tested its 150-day moving average a few months before major breakouts.
One possibility is Gold trades up to $2030-$2050 before correcting to the 150-day moving average, currently at $1962 and sloping higher.
(Click on image to enlarge)
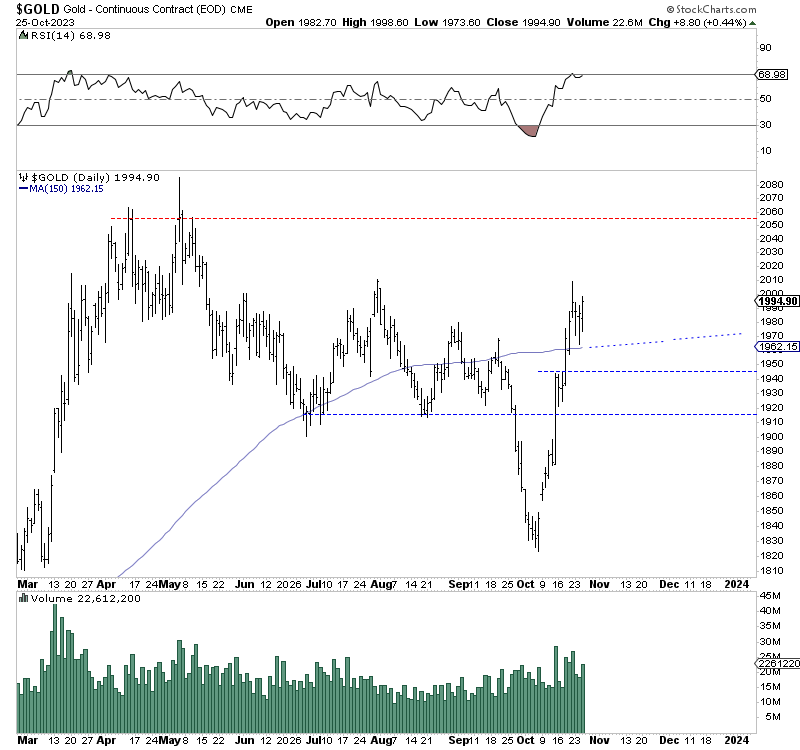
Gold’s strength in recent days leads me to think it has a chance to test $2030-$2050 before a retracement. If that comes to pass, look for support at the 150-day moving average.
On the other hand, if $2000 resistance holds firm in November, then look for a test of $1940 and perhaps $1920.
Gold rallying back to $2000 so quickly is a positive sign for an eventual breakout. The miners, juniors, and Silver space need Gold to surpass $2100 before they can outperform.
More By This Author:
Balancing Technical & Intermarket Analysis With Macro DriversShort-Term Positive Divergences For Gold
Gold To Pause At $2000 Resistance


Comments
Log in or sign up to join the conversation.