
Is The Gold Trade Really Over?
What's going on with gold? While most stocks and many asset classes continued to move higher in the back half of 2020, gold showed a decline of roughly 15% from peak to trough. Thus far this year, gold is down by around 3%, relative to the S&P 500/SPX's (SP500) gain of about 1%.
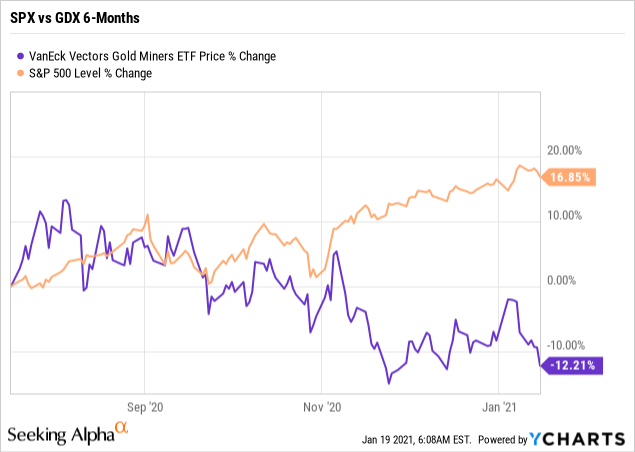
If we look at gold miners, the image is even worse:
Data by YCharts
The past six months have been tough for the gold mining space. We see a clear underperformance here as we look a the SPX's 16.85% gain vs. VanEck Vectors Gold Miners ETF's (GDX) decline of 12.21% in the same time frame.
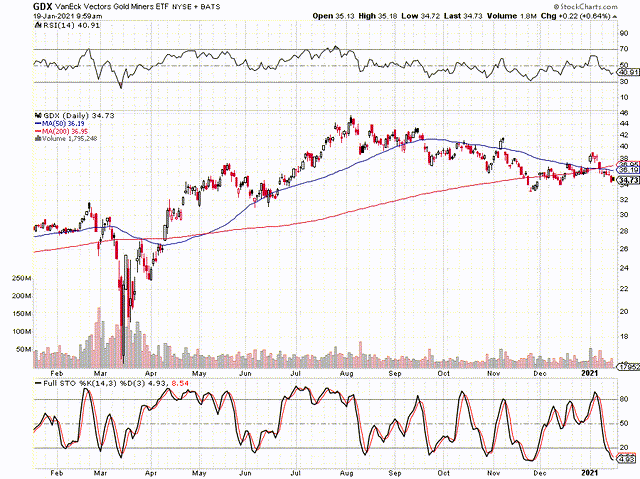
GDX 1-Year
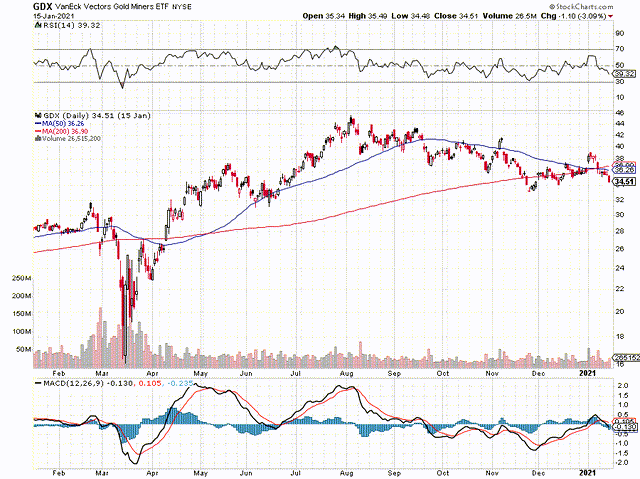
Source: StockCharts.com
If we take a closer view, it's even worse, about a 25% decline in GDX from the highs reached in early August 2020. This relative underperformance has some former gold enthusiasts asking if the gold trade is over.
Putting Things in Perspective
Granted, the past six months have been difficult for the gold space. However, to get a clearer image let's take a longer-term view.
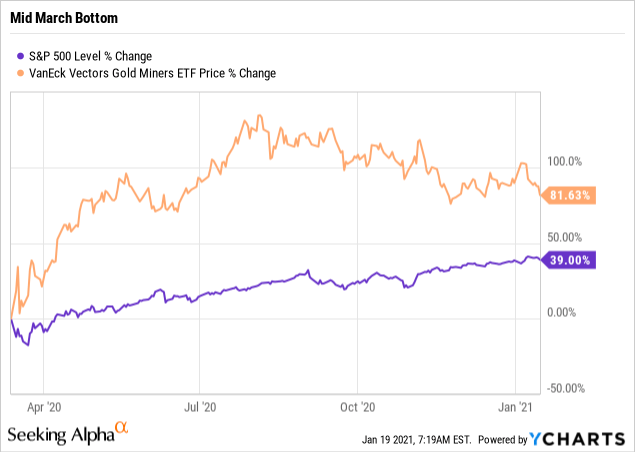
Data by YCharts
So, if we look back a bit further, we see that despite the gold miners' recent rout, returns have roughly doubled the SPX's since around the mid-March bottom. In fact, it doesn't matter if we go back one three or five years, GDX illustrates clear outperformance over the SPX.
Yes, but Why is Gold Going Down Lately?
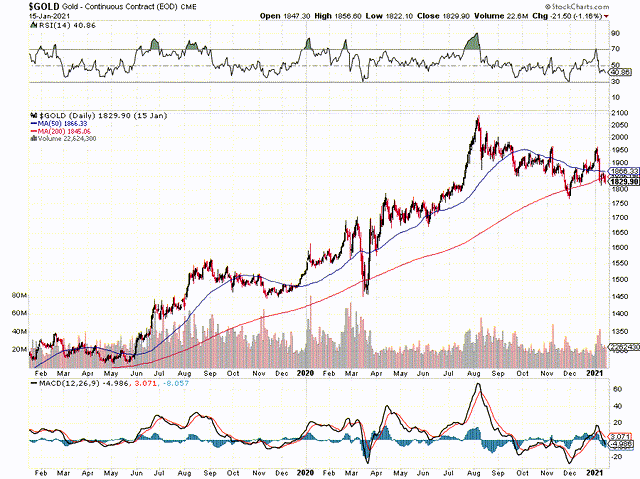
If we disregard the recent slump, we see that gold had appreciated by roughly 70% in slightly over a year (May 2019 - 2020 August ATH). This is quite the move for gold in a relatively short period of time. Moreover, GDX was up by well over 100% over the same time frame, and had skyrocketed by approximately 188% from its mid-March bottom to its early August top in 2020. Therefore, the recent declines could be due to a prolonged correction in a long-term bull market cycle.
10-Year Treasury
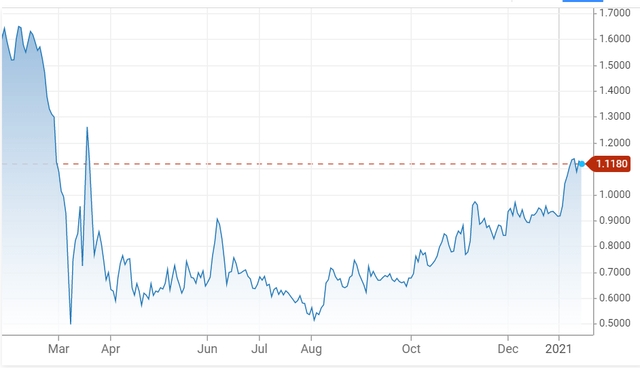
Source: CNBC.com
There's been some talk that gold is going down because of a rise in interest rates. So, the 10-year has nearly doubled since it bottomed in early August of last year. However, I don't think that rates are likely to go notably higher or even stay elevated for a prolonged time frame. This is unlikely due to enormous national and overall debt loads in the U.S. The economy is not likely to illustrate adequate growth in a higher rate, or in a "normalized" rate environment for that matter.
Right now, the national debt is approaching $28 trillion, and the U.S.'s total debt to GDP sits at a whopping 146%. These are remarkably elevated figures, and we have to consider that this gigantic debt load needs to get serviced perpetually. As the national debt is largely made up of five-, 10-, and 30-year Treasuries, we can deduce that the 10-year mark makes for a favorable gauge to compute servicing payments.
At it's current 1.1% yield, the annual servicing payment would amount to roughly $370 billion. The U.S.'s actual federal budget deficit is at an alarmingly high $4.5 trillion or so already. As the perpetual deficits continue to make the national debt stack ever taller, higher Treasury rates make servicing payments rise. Thus, a 2% 10-year coupled with a $30 trillion national debt would amount to an annual servicing payment of roughly $660 billion. Yes, $660 billion just gone from the national budget simply for servicing payments alone.
These are gigantic numbers, and not likely sustainable in my view. Therefore, higher rates are not likely a realistic phenomenon going forward. The only way that higher rates make any economic sense is in a substantially higher inflation environment. If we get inflation running at 4%-5%, then we could probably see a 2%-3% 10-year yield for a sustainable period of time. However, a higher inflationary environment would offset higher rates as far as gold is concerned, thus creating a bullish scenario for the yellow metal regardless.
10-Year Long-term Trend
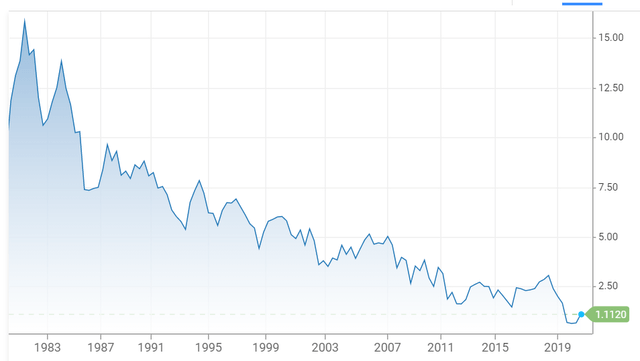
The long-term trend for the 10-year is lower and lower due to perpetual increases in the national, as well as overall debt loads. This dynamic of extremely high debt and lower rates is not likely going to change, as the economy simply cannot function productively in a higher or a "normalized" rate regime.
Therefore, we appear to be getting a temporary pop in rates, but it's not sustainable in my view. In fact, we are likely going lower interest rate wise, much like Japan and Europe towards zero and possibly into negative territory. Furthermore, the price of gold has a cleaner long-term correlation with the expansion of the monetary base rather than with interest rate fluctuations.
Monetary Base
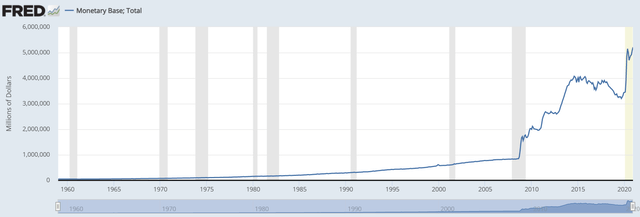
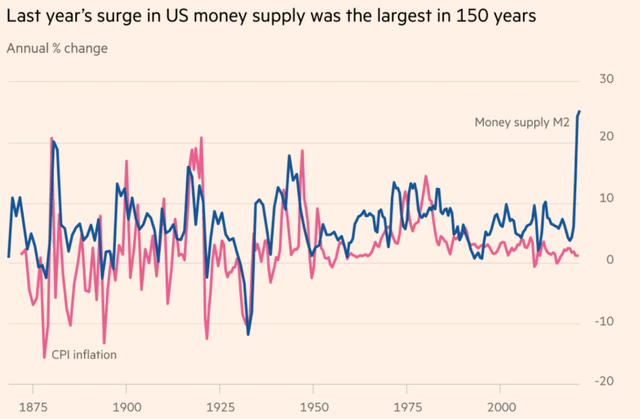
The base is exploding again. This is somewhat similar to the phenomenon following the financial crisis of 2008. However, we're still likely in the relatively early stages of the expansion cycle, and the monetary base could increase substantially above $5 trillion in my view. If we look at M2 (broader money supply), last year's jump was staggering.
M2
The Bottom Line
We are essentially seeing a dilution of the fiat monetary system, and higher inflation is very likely on its way. Furthermore, we've established that gold's price and monetary base expansion have a very strong correlation on a long-term basis. Thus, despite the shorter-term gyrations, there's a very strong case for substantially higher gold prices going forward. We also know that where gold goes gold miners follow. Therefore, gold miners are likely trading near the ground floor if not in the basement right now.
Some of our favorite gold mining names:
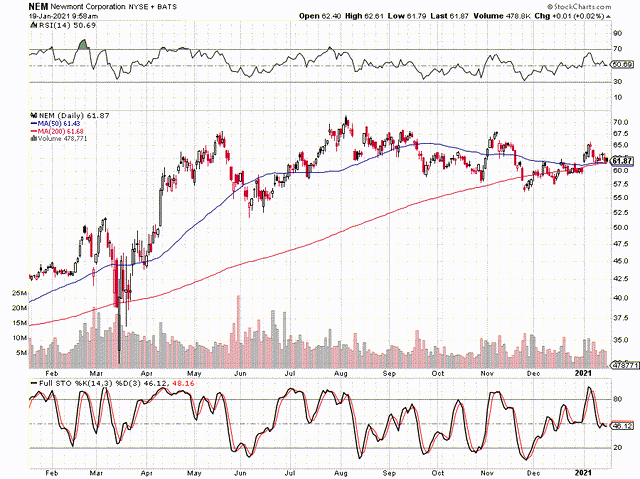
Newmont Mining (NEM)
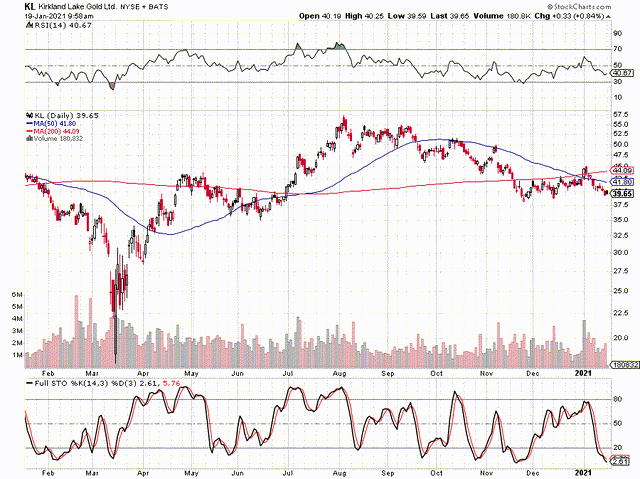
Kirkland Lake Gold (KL)
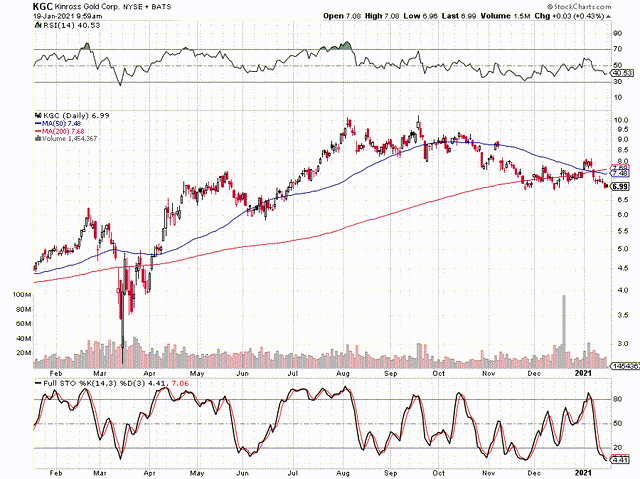
Kinross Gold Corp (KGC)
Gold mining, majors ETF (GDX)
Junior gold miners ETF (GDXJ)
Disclosure: I am/we are long GDX GDXJ KGC KL NEM. I wrote this article myself, and it expresses my own opinions. I have no business relationship with any company whose stock is mentioned in this ...
more

