
Is The Economy Overheating?
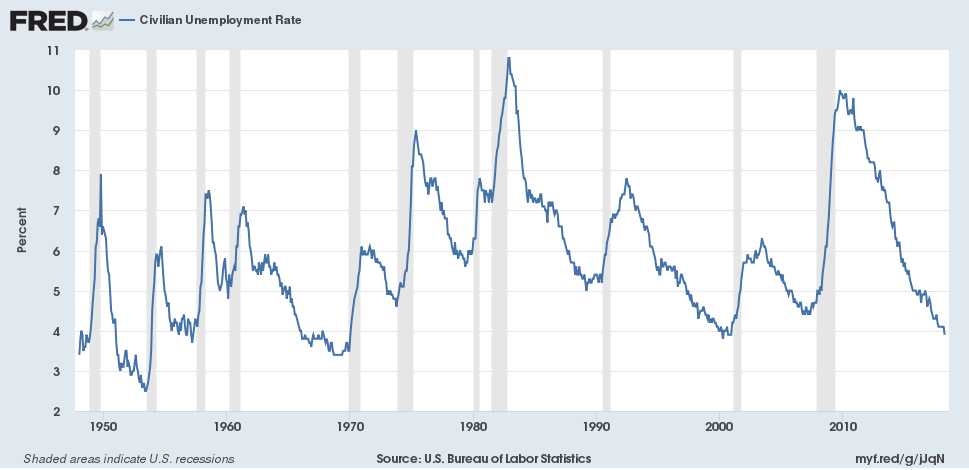
The Bureau of Labor Statistics announced yesterday that the unemployment rate was down to 3.9% in April. That’s nearly as low as it’s been any time in the last half century. Does that mean the U.S. economy faces some problems ahead?
Worries about the unemployment rate getting too low are usually framed in terms of the Phillips Curve. One simple formulation describes the Phillips Curve as a negative relation between the change in the inflation rate and the level of unemployment.
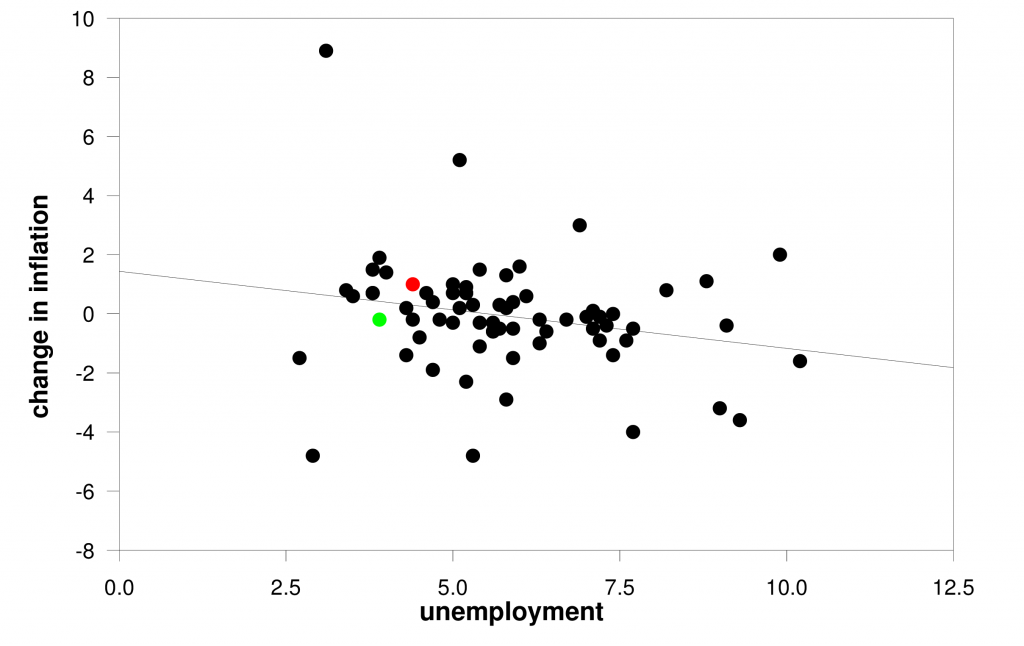
Vertical axis: year-over-year change in the inflation rate, where the inflation rate is measured as the year-over-year percent change in the quarterly implicit price deflator on personal consumption expenditures (first quarter to first quarter, 1949-2018). Horizontal axis: unemployment rate in April of each year. Red dot is 2017 and green is 2018. OLS regression line has R2 of 5% and Newey-West t-statistic (with 2 lags) of -1.96.
That estimated relation says that if the unemployment rate was at 5.5%, inflation this year would be expected to be the same as last year. With unemployment at 3.9%, inflation this year would be expected to be 0.4% higher than the year before. But in fact, inflation over the last year was 0.2% lower than it had been the year before, as represented by the green dot in the figure.
As I’ve noted before, that kind of miss is pretty much par for this relation. Indeed, the standard error of estimate for the regression is 1.9. In other words, when the unemployment rate is at 3.9%, we expect this year’s inflation rate to be 0.4% higher than the year before, plus or minus 3.8%.
Still, if the claim of the fitted Phillips Curve is accurate, it certainly means we could not stay at 3.9% unemployment forever. If we were to try to do it for 5 years in a row, for example, it would predict an inflation rate at the end of 5 years that would be 2% higher than when we started. We could easily live with 2.4% inflation. But 4% inflation would be a problem.
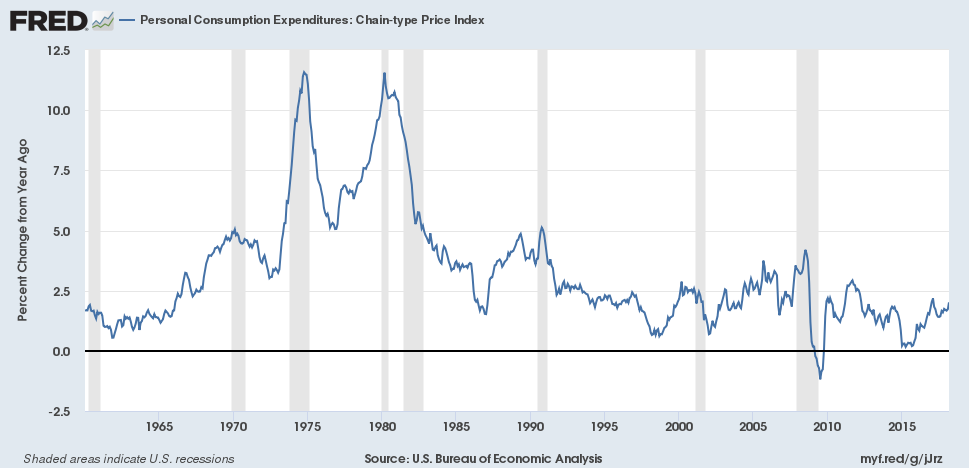
On average, inflation recently has been closer to the Fed’s 2% target than it had been for some time. But note that the FOMC statement from the Fed’s meeting last week significantly added the word “symmetric” to the expression “2% objective.” In other words, the Fed says that it is equally keen to avoid the 1.6% and below inflation numbers of previous years as it is the possibility of 2.4%
It is worth noting that commodity prices, sometimes viewed as a leading indicator of inflation, have been moving up. Since the start of 2017, oil is up 18% (logarithmically), copper 15%, iron and steel 10%, and lumber 18%.
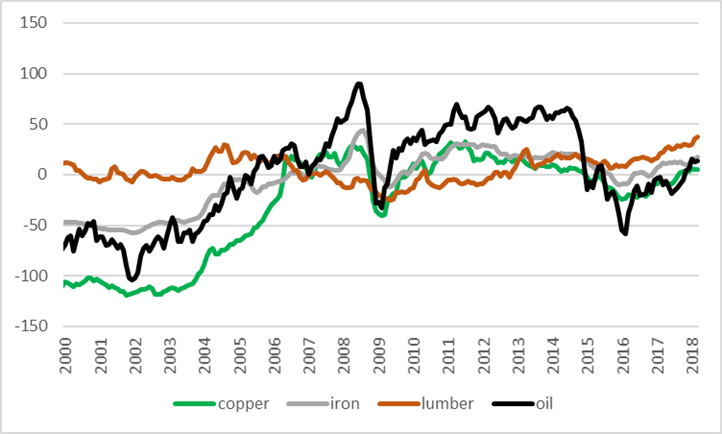
100 times the difference in the natural logarithm in month t and the natural logarithm in Jan 2007 in the spot price of West Texas Intermediate (WTISPLC) and in the producer price indexes for copper, iron and steel, and softwood lumber.
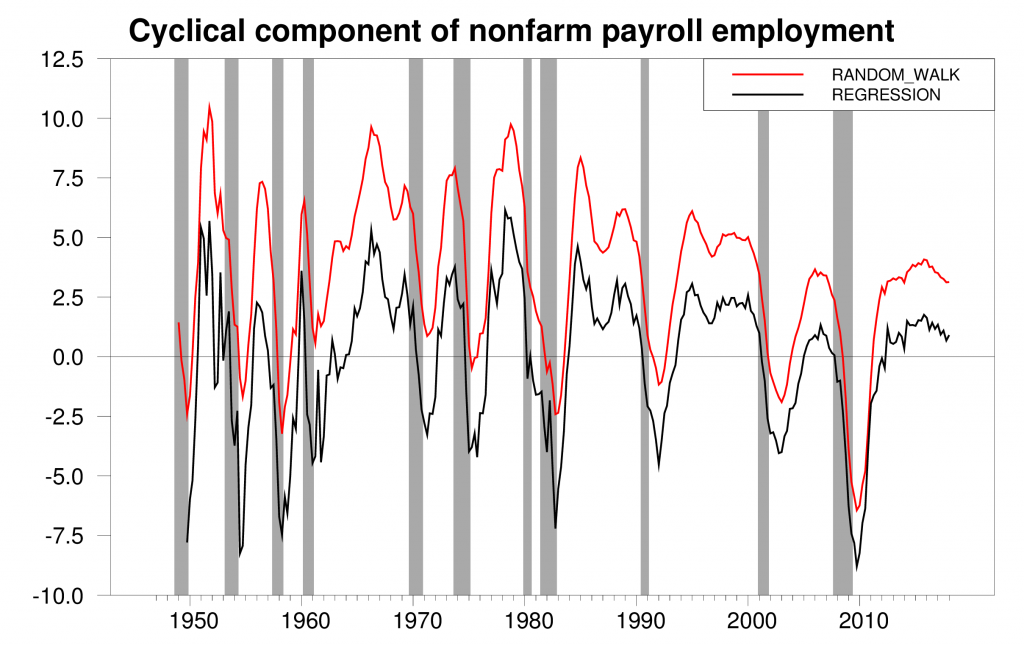
There’s one other aspect of the recent BLS employment numbers I’d like to mention, and that is the nonfarm payroll counts from the BLS’s separate establishment survey. I was interested to update my calculations of the cyclical component of this series, shown in red and black in the graph below. The cyclical component typically starts to turn down several years before a recession. And it’s now started to turn down.
So let me return to the question I posed in the title. Is the economy overheating? My answer is no. But the Fed better keep an eye on the stove.
Disclosure: None.


