
Is Oil Set To Break Out From Congestion On The Daily Chart?
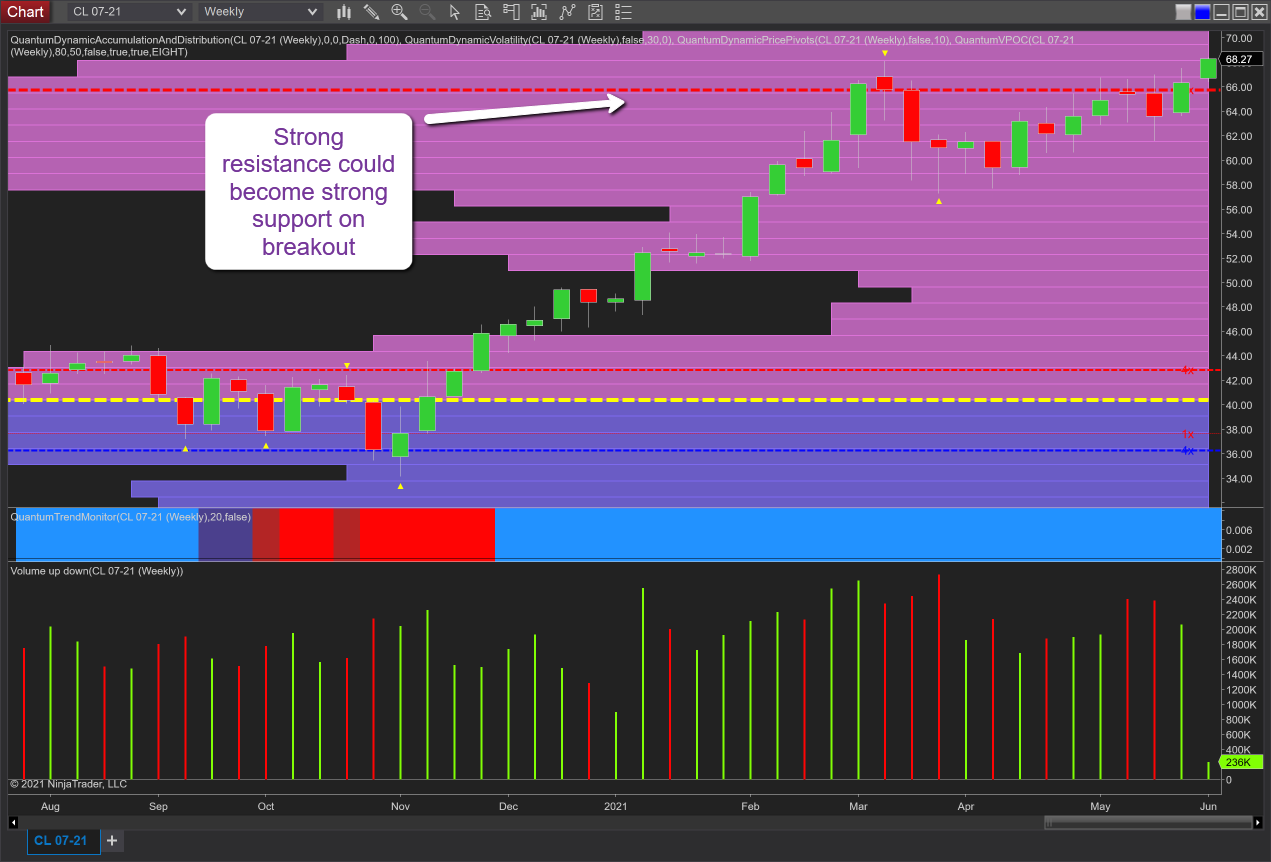
For the purposes of this post on oil I’ve moved to the weekly chart for the commodity which continues to test the extremely strong level of price resistance at $66 per barrel, a level I have referenced many times in my analysis, and perhaps this is the week when we will see a continuation of the longer-term bullish momentum. And the reason is the gapped-up open and positive start to this holiday-shortened week which has seen the price open at $66.68 per barrel for the WTI contract and has since moved to trade at $68.26 per barrel at the time of writing. Clearly much can change in the course of the week, but should we see a close above the resistance denoted with the red dashed line of the accumulation and distribution indicator, then this may be the precursor to a sustained move higher, and one which would also be supported by the fundamentals, with Memorial day kicking off the traditional US driving season.
From a technical perspective, it has been the resistance at $66 per barrel which has proved to be the stumbling block for oil since March, and provided we see a solid close above this level, then it will undoubtedly provide a solid platform of support and for the price to test $70 per barrel and beyond.
(Click on image to enlarge)
Disclaimer: Futures, stocks, and spot currency trading have large potential rewards, but also large potential risk. You must be aware of the risks and be willing to accept them in order to invest in ...
more

